Shale Oil Breakeven Prices
Summary
This paper examines published estimates of shale oil breakeven prices, contrasts the quoted breakeven price with industry performance over the period and investigates the disconnect between published breakeven prices and actual breakeven prices at the corporate level.
The paper then looks at Whiting Petroleum as an example and estimates the oil price Whiting required to breakeven in 2019. It finds that Whiting would have required a price of $70/bbl. WTI and $77/bbl. Brent.
The paper concludes that breakeven prices at a corporate level should be calculated on a case by case basis, with the Whiting example indicating that actual breakeven prices could be $20/bbl. – $30/bbl. above published levels.
Shale Oil Breakeven
The shale oil industry has been advertising attractive breakeven prices for many years. During the last industry downturn, the sector focused on efficiency improvements and cost reductions to remain competitive with conventional international oil fields.
Rystad Energy published the following chart in 2019 (i), showing that shale oil’s average breakeven price was $46/bbl. Brent, lower than Russian production and within touching distance of the OPEC’s heartlands in the Middle East. Based on this chart, the US shale industry has a good chance of beating Russia in the current oil price war and calling Saudi Arabia’s bluff.
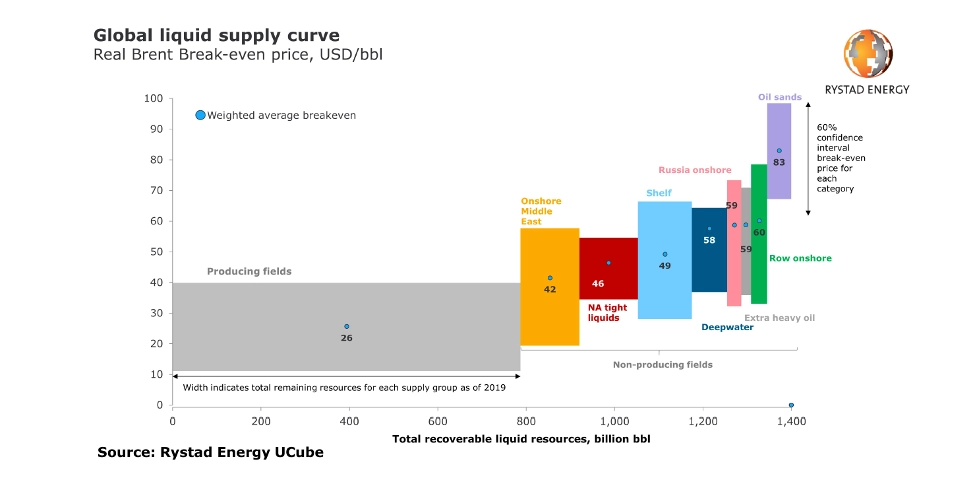
Figure 1 - Rystad Energy Breakeven Price
It should be note that the Rystad figures are for new producing fields, they do not include legacy production from prior years of development, which would have much lower breakeven prices. Corporate breakeven prices should therefore be even lower than the Rystad estimate as they include some legacy production.
Brent crude averaged $64/bbl. in 2019 and West Texas Intermediate (WTI) averaged $57/bbl. (ii), both well above the Rystad breakeven price. At these commodity prices and those breakeven prices, 2019 should have been a bonanza for US shale; the year that investors started to see solid cashflow from their investments.
How did things go? There was a big increase in production, but still no positive cashflow. Free cashflow for the industry, defined in this case as 34 shale focused companies, in 2019 was negative US$ 2.1 billion (iii), a US$ 2.1 billion loss. As the IEEFA article, from which this data was taken, illustrates, this was best year the shale industry has ever had, but still disappointing given a price environment that was well above apparent breakeven.
What Went Wrong?
The first thing to look at is the estimated breakeven price of $46/bbl. Brent. The Federal Reserve bank of Dallas (iv) published the following data on WTI prices for new wells, see Figure 2, below.

Figure 2 - Federal Reserve Bank of Dallas Breakeven Prices
The first thing to note about these breakeven prices is that they are all higher than the Rystad Energy estimate, even the lowest breakeven is higher than Rystad’s average. The second thing to note is that these are WTI rather than Brent. WTI trades at a discount to Brent, the average discount in 2019 was $7 per barrel. If we convert these WTI prices to Brent, then the breakeven range is $54/bbl. - $60/bbl. Brent.
The third thing to focus on is the question being asked - “What WTI oil price does your firm need to profitably drill a new well?”. Note that the question is not, at what price is your company profitable, or a what price will your company generate surplus cashflow, or even, at what price does your development program breakeven.
The Dallas Federal Reserve question is useful. If you are running a factory and need to decide whether to produce widgets next month, then whether you can sell the widgets for more than the marginal cost of their production and distribution is an appropriate way to frame the decision.
However, incremental well breakeven is not an appropriate way to frame the profitability or cash generative capacity of an entire industry, because it does not include many of the costs incurred by the businesses in that industry. It doesn’t include infrastructure costs, selling, general and administrative costs, the costs for transportation, storage and gas handling, the cost to secure leases or the cost to service the debt required to fund the investment.
This means that the overall breakeven oil price required for a business in the shale oil industry is much higher than the Rystad energy figure of $46/bbl. and even higher than the US$54/bbl. – US$60/bbl. Brent equivalent from the Dallas Federal Reserve survey. This is why the industry doesn’t generate free cash flow despite commodity prices exceeding published breakeven prices.
How much higher? The answer to this question, unfortunately, is that it depends. That may be why this kind of breakeven figure, though incorrect, is so widely used. We can look at an example to see how significant the difference could be.
Whiting Petroleum Example
Whiting Petroleum is a publicly listed independent, focused on production from the Rocky Mountains, primarily the Williston Basin which includes the Bakken and Three Fork plays. Whiting is topical as it filed for bankruptcy on April 1st, a couple of days ago. Whiting recorded a net loss of US$ 241.2 million in 2019, with an average if 112,000 bbl./day of oil production and a realized price of $50/barrel, a $7 discount to WTI (v).
If we define breakeven as cashflow neutral including investing and financing costs, then what oil price would Whiting have to realize to breakeven in 2019? If we assume that debt interest and principal due in 2019 must be paid down, without additional borrowing, then Whiting would require a realized oil price of $63/bbl. Given the $7/bbl. discount, this is the equivalent of $70 per barrel WTI and $77 per barrel Brent.
The Whiting Petroleum corporate breakeven is far higher than either the Rystad or the Dallas Federal Reserve figures. It implies that actual breakeven prices at the corporate level could be $20 / bbl. -$30 / bbl. higher than published breakeven prices.
(i) “Rystad Energy Ranks the Cheapest Sources of Supply in the Industry”, https://www.rystadenergy.com/newsevents/news/press-releases/Rystad-Energy-ranks-the-cheapest-sources-of-supply-in-the-oil-industry-/, May 9th 2019
(ii) “Crude oil prices were generally lower in 2019 than in 2018”, https://www.eia.gov/todayinenergy/detail.php?id=42415, US Energy Information Administration, January 7th 2020.
(iii) “Fracking companies’ 2019 performance signals ongoing crisis”, Institute for Energy Economics and Financial Analysis, Clarke Williams-Derry, Kathy Hipple and Tom Sanzillo, March 19th, 2020.
(iv) “Energy Slideshow”, Federal Reserve Bank of Dallas, March 4th, 2020.
(v) “Whiting Petroleum Form 10-K for the fiscal year ending December 31st, 2019
Conversation


Shale Oil Breakeven Prices
Summary
This paper examines published estimates of shale oil breakeven prices, contrasts the quoted breakeven price with industry performance over the period and investigates the disconnect between published breakeven prices and actual breakeven prices at the corporate level.
The paper then looks at Whiting Petroleum as an example and estimates the oil price Whiting required to breakeven in 2019. It finds that Whiting would have required a price of $70/bbl. WTI and $77/bbl. Brent.
The paper concludes that breakeven prices at a corporate level should be calculated on a case by case basis, with the Whiting example indicating that actual breakeven prices could be $20/bbl. – $30/bbl. above published levels.
Shale Oil Breakeven
The shale oil industry has been advertising attractive breakeven prices for many years. During the last industry downturn, the sector focused on efficiency improvements and cost reductions to remain competitive with conventional international oil fields.
Rystad Energy published the following chart in 2019 (i), showing that shale oil’s average breakeven price was $46/bbl. Brent, lower than Russian production and within touching distance of the OPEC’s heartlands in the Middle East. Based on this chart, the US shale industry has a good chance of beating Russia in the current oil price war and calling Saudi Arabia’s bluff.

Figure 1 - Rystad Energy Breakeven Price
It should be note that the Rystad figures are for new producing fields, they do not include legacy production from prior years of development, which would have much lower breakeven prices. Corporate breakeven prices should therefore be even lower than the Rystad estimate as they include some legacy production.
Brent crude averaged $64/bbl. in 2019 and West Texas Intermediate (WTI) averaged $57/bbl. (ii), both well above the Rystad breakeven price. At these commodity prices and those breakeven prices, 2019 should have been a bonanza for US shale; the year that investors started to see solid cashflow from their investments.
How did things go? There was a big increase in production, but still no positive cashflow. Free cashflow for the industry, defined in this case as 34 shale focused companies, in 2019 was negative US$ 2.1 billion (iii), a US$ 2.1 billion loss. As the IEEFA article, from which this data was taken, illustrates, this was best year the shale industry has ever had, but still disappointing given a price environment that was well above apparent breakeven.
What Went Wrong?
The first thing to look at is the estimated breakeven price of $46/bbl. Brent. The Federal Reserve bank of Dallas (iv) published the following data on WTI prices for new wells, see Figure 2, below.
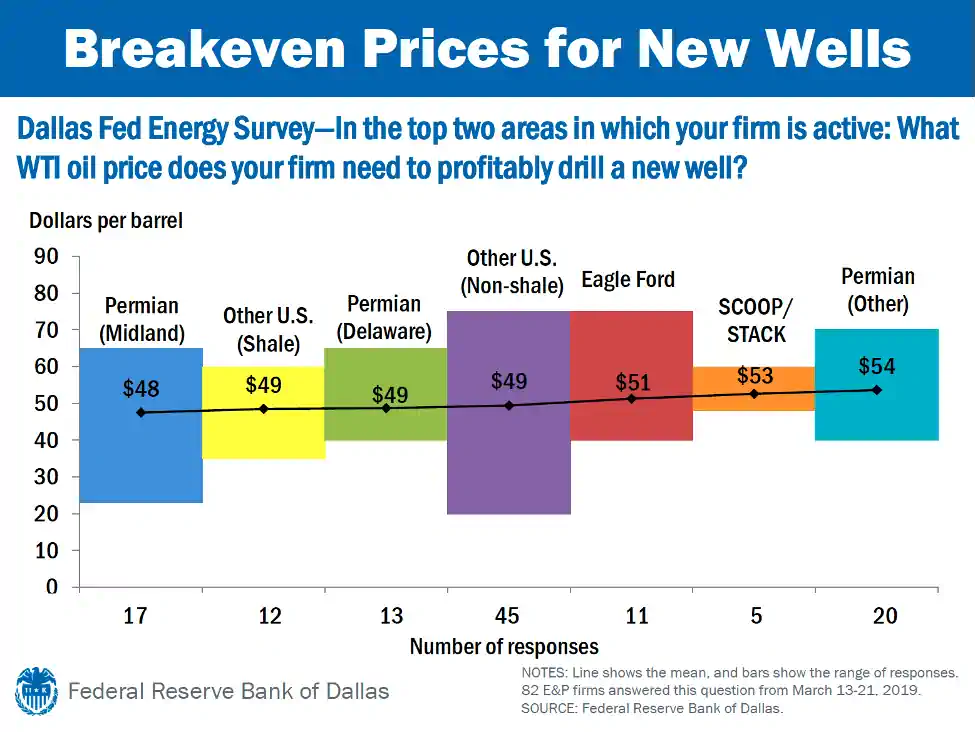
Figure 2 - Federal Reserve Bank of Dallas Breakeven Prices
The first thing to note about these breakeven prices is that they are all higher than the Rystad Energy estimate, even the lowest breakeven is higher than Rystad’s average. The second thing to note is that these are WTI rather than Brent. WTI trades at a discount to Brent, the average discount in 2019 was $7 per barrel. If we convert these WTI prices to Brent, then the breakeven range is $54/bbl. - $60/bbl. Brent.
The third thing to focus on is the question being asked - “What WTI oil price does your firm need to profitably drill a new well?”. Note that the question is not, at what price is your company profitable, or a what price will your company generate surplus cashflow, or even, at what price does your development program breakeven.
The Dallas Federal Reserve question is useful. If you are running a factory and need to decide whether to produce widgets next month, then whether you can sell the widgets for more than the marginal cost of their production and distribution is an appropriate way to frame the decision.
However, incremental well breakeven is not an appropriate way to frame the profitability or cash generative capacity of an entire industry, because it does not include many of the costs incurred by the businesses in that industry. It doesn’t include infrastructure costs, selling, general and administrative costs, the costs for transportation, storage and gas handling, the cost to secure leases or the cost to service the debt required to fund the investment.
This means that the overall breakeven oil price required for a business in the shale oil industry is much higher than the Rystad energy figure of $46/bbl. and even higher than the US$54/bbl. – US$60/bbl. Brent equivalent from the Dallas Federal Reserve survey. This is why the industry doesn’t generate free cash flow despite commodity prices exceeding published breakeven prices.
How much higher? The answer to this question, unfortunately, is that it depends. That may be why this kind of breakeven figure, though incorrect, is so widely used. We can look at an example to see how significant the difference could be.
Whiting Petroleum Example
Whiting Petroleum is a publicly listed independent, focused on production from the Rocky Mountains, primarily the Williston Basin which includes the Bakken and Three Fork plays. Whiting is topical as it filed for bankruptcy on April 1st, a couple of days ago. Whiting recorded a net loss of US$ 241.2 million in 2019, with an average if 112,000 bbl./day of oil production and a realized price of $50/barrel, a $7 discount to WTI (v).
If we define breakeven as cashflow neutral including investing and financing costs, then what oil price would Whiting have to realize to breakeven in 2019? If we assume that debt interest and principal due in 2019 must be paid down, without additional borrowing, then Whiting would require a realized oil price of $63/bbl. Given the $7/bbl. discount, this is the equivalent of $70 per barrel WTI and $77 per barrel Brent.
The Whiting Petroleum corporate breakeven is far higher than either the Rystad or the Dallas Federal Reserve figures. It implies that actual breakeven prices at the corporate level could be $20 / bbl. -$30 / bbl. higher than published breakeven prices.
(i) “Rystad Energy Ranks the Cheapest Sources of Supply in the Industry”, https://www.rystadenergy.com/newsevents/news/press-releases/Rystad-Energy-ranks-the-cheapest-sources-of-supply-in-the-oil-industry-/, May 9th 2019
(ii) “Crude oil prices were generally lower in 2019 than in 2018”, https://www.eia.gov/todayinenergy/detail.php?id=42415, US Energy Information Administration, January 7th 2020.
(iii) “Fracking companies’ 2019 performance signals ongoing crisis”, Institute for Energy Economics and Financial Analysis, Clarke Williams-Derry, Kathy Hipple and Tom Sanzillo, March 19th, 2020.
(iv) “Energy Slideshow”, Federal Reserve Bank of Dallas, March 4th, 2020.
(v) “Whiting Petroleum Form 10-K for the fiscal year ending December 31st, 2019
Conversation


Explore Our Services

Business Development
Oil & Gas an extractive industry, participants must continuously find and develop new oil & gas fields as existing fields decline, making business development a continuous process.

Strategy
We approach strategy through a scenario driven assessment of the client’s current portfolio, organizational competencies, and financial framework. The strategy defines portfolio actions and coveted asset attributes.
Origination
Deal origination consists of identifying coveted assets, assets with attributes consistent with the client’s strategy, and qualified buyers. We advocate a proactive approach to business development and will undertake outreach on our client’s behalf.
Transaction Support
Transaction support consists of in depth asset evaluation, negotiation of commercial agreements or preparation of license round submission and close out of conditions. We can also aid in joint venture set up and management and asset maturation as required.