Oil Market Forecast - April 2021
Summary
This April edition of our Oil Market Forecast features a review of Occidental’s acquisition of Anadarko after their first full year together. This edition also sees OPEC+ issue a new supply schedule running through to July, showing an expansion in production, as the IEA raises its full year 2021 oil demand estimate.
A few key points:
- Occidental recorded a loss of nearly $16 billion dollars in 2020
- Occidental’s 2020 cashflow from operations, when recast for oil prices above $45 per barrel, shows improvement against its 2018 performance.
- With the exception of the US Gulf of Mexico, the acquisition appears to have increased Occidental’s size, rather than diversified its operations.
- The acquisition brought deep water production capability, but it isn’t clear to what degree exploration and development capability carried over. The exit from Mozambique LNG looks like a missed opportunity.
- Occidental’s production has doubled, while recast cashflow from operations at a WTI price of $60 per barrel has only increased by 25%. Several smaller asset acquisitions may have satisfied the same objective at a lower premium.
- We expect oil supply from OPEC+ nations to exceed the latest production schedule and the schedule to be relaxed further as the year progresses.
- We expect global oil storage to reach its long term average in the third quarter of the year and remain at around that level through 2022, before drawing down.
- Both Brent and WTI futures prices rose over the last month.
- US rig count continues to grow, but as yet, the growth rate does not show signs of acceleration.
Occidental – Anadarko Acquisition
Occidental’s $57 billion takeover of Anadarko was the largest oil and gas transaction of 2019, by an order of magnitude. It was notable at the time not just for its size, but for the manner in which it was conducted. Anadarko had agreed to a sale to Chevron before Occidental swooped in with a higher bid and Chevron declined to counter. The transaction closed on August 8th, 2019, meaning 2020 was the first full year for the combined entity.
We start with a brief history of Occidental and Anadarko and then look at the relative performance of the pre and post-acquisition entity through three lenses:
- Financial Performance
- Asset Mix
- Capability
The analysis is based on Occidental and Anadarko public filings between 2019 and 2021(1), (2), (3).
History
Anadarko was formed in 1959, as a subsidiary of the Panhandle East Corporation, to develop gas fields in the Anadarko basin in western Oklahoma and the Texas panhandle. It was spun off as an independent public company in 1986. Headquartered in the Woodlands, by 2018, Anadarko had grown to a company that produced more than 665,000 barrels of oil equivalent per day.
Anadarko consisted of an upstream and a midstream business. Upstream dominated, delivering over $ 11 billion in revenues in 2018 against $ 1.6 billion for midstream. The upstream business was US focused, with the US accounting for 86% of production volume and 79% of revenue in 2018.
US production was centered around Anadarko’s position in the DJ Basin, which accounted for more than 260,000 barrels of oil equivalent per day of production. It also held positions in the Powder River Basin, the Delaware Basin in the Permian, and a large deep water position in the US Gulf of Mexico, operating ten production facilities and participating in 34 fields. Anadarko had been an early pioneer in the US Gulf of Mexico, but by early 2018 its focus had shifted to the US onshore – in 2018 it drilled 2 exploration wells and 2.6 development wells on the Gulf of Mexico, compared to 17 exploration wells and 399.1 development wells in the US onshore.
The international business was similarly diverse, with production onshore Algeria and deep water Ghana and exploration in Canada, Colombia, Peru, and South Africa. Anadarko also operated and LNG scale gas discovery in Mozambique, which was still in the pre-FID stage in 2018.
Occidental was formed in California in 1920. By 2018 it was headquartered in Houston and had large upstream, midstream and chemicals business. Occidental was larger in revenue terms, but with a similar size of upstream business to Anadarko, with 2018 production of 658,000 barrels of oil equivalent per day contributing $ 10 billion of Occidental’s $17 billion in revenue for the year.
Occidental had a more international upstream business than Anadarko, with its international operations providing nearly 50% of production. It was also a lot more focused. Its US business was built on two companies in the Permian basin – Permian Resources, which developed shale oil fields and Permian EOR, which recovered oil from conventional fields using CO2 injection. The international business was similarly focused – heavy oil in Oman and Colombia and gas in the UAE and Qatar. Occidental did not have any deep water or LNG exposure.
Financial Performance
In as much as the oil & gas industry has a normal year, 2020 was not it. Occidental suffered the same asset impairments as everyone else, reporting a full year loss for 2020 of nearly $16 billion. Low commodity prices impose a double penalty on oil & gas companies, as not only do they see reduced revenue, but they are also forced to re-state their reserves, imposing large non-cash charges. Consequently, the approach taken in assessing financial performance here is to consider cashflow from operations rather than net income, with revenue from upstream oil & gas recast for a range of oil prices.
This provides a picture of cash generative capacity of the company incorporating both cost structure and interest payments, normalized for a range of oil prices. This approach can be employed with oil & gas companies as changes in commodity prices fall (mainly) to the bottom line. Mainly, because some fiscal regimes do vary the state share levied with price, which would have an impact on the results.
The disadvantages are that this approach does not consider capital investment or financing required to maintain the business and that the enterprise down approach is far less rigorous than performing the same analysis on an asset or contract level. Not does it consider how fluctuations in commodity price would affect midstream or chemicals business.
The key benefit of the approach in this case is that the analysis is straightforward and can be completed using public data. The analysis was conducted based on Occidental at the end of 2018 and Occidental at the end of 2020 for West Texas Intermediate (WTI) prices between $40/barrel and $80/barrel. The plot of cashflow from operations for both cases is shown in Figure 1, below.

Figure 1 - Recast Cashflow from Operations vs Oil Price
As Figure 1 shows, the cash generative capacity of Occidental, post-merger is greater than the cash generative capacity of the firm pre-merger for WTI prices above $45 per barrel. At $60 per barrel, the combined entity generates $ 2 billion more per year in cashflow than pre-merger Occidental, a 25% increase. This is due to the incremental revenue from increased production outstripping the incremental cost of production, overhead and debt interest at prices above $45 per barrel. From a cashflow perspective, at least, the acquisition seems to have improved Occidental’s position.
Asset Mix
The pre-acquisition Occidental was a very focused company. There was little overlap with Anadarko, with Anadarko’s smaller position in the Delaware Basin the only shared geography. Occidental made some immediate moves to trim parts of the portfolio. The earliest exit was the sale of its stake in Mozambique LNG and its South African assets to Total in 2019. This deal originally included the Algeria and Ghana assets, but these were excluded after the Algerian government blocked the sale. The Ghana assets were put back on sale in 2020 and at the time of writing it reported they may be acquired by a Carlyle backed entity. It has exited its Colombian heavy oil assets and other international exploration positions, except for Colombia.
Occidental reported proved reserves of 2.9 billion barrels of oil equivalent in 2020, up from 1.9 billion barrels of oil equivalent in 2018. Production for 2020 was reported at 1,326,027 barrels of oil equivalent per day, just over the combined 2018 Occidental and Anadarko production from 2018. This is quite remarkable given that Occidental imposed the same investment cuts as the rest of the industry in 2020.
Occidental, as an enterprise, became more dependent on upstream oil and gas and much more focused on the United States, accounting for neatly 80% of production in 2020 as opposed to 57% in 2018. It also became gassier, with gas accounting for 29% of production in 2020 against 24% in 2024.
The only one of Anadarko’s non-US producing assets that Occidental has retained is the interest in Algeria. From an asset perspective, this kind of long life, low technical risk, Production Sharing Contract (PSC) is similar to Occidental’s existing Middle Eastern portfolio.
The DJ Basin assets have similar performance characteristics to the Permian business – they avoid exploration risk and enjoy short development cycles but have high capital intensity and steep production declines. The only real change to Occidental’s asset mix was the retention of Anadarko’s deep water Gulf of Mexico business. This is a business that requires occasional injections of large amounts of capital but can be very profitable with the right assets and high oil prices. It is still not clear what Occidental intend for the Gulf of Mexico business.
The US Gulf of Mexico aside, the post-acquisition Occidental looks like more of a bulked up, US centric version of the original. The decision to exit Ghana is understandable as in country production was no longer material for a company of Occidental’s size. The decision to exit Mozambique, while it was probably forced on Occidental by the financial reality of both the need to finance the merger and ongoing capital commitments, looks like more of a missed opportunity. Maintaining some form of non-operated minority position would have given Occidental an opportunity to learn and exposure to the business.
Capability
The pre-acquisition Occidental had an established shale oil capability through its large position in the Permian. It had established a differentiated capability in Enhanced Oil Recovery (EOR), through its Permian CO2 flood business as well as steam floods in Oman and heavy oil in Colombia. It appeared to be a company that favored large, long life assets with low exploration risk where it could focus on improving recovery. It had material gas production in the UAE and Qatar and complimentary midstream businesses to handle associated liquids.
The asset mix and activity spread suggests a company that avoided conventional exploration and grew through acquisition and enhancing recovery in material, discovered fields. There was no deep water capability and no LNG experience. The geographic footprint was also very tight – even overseas it was a cluster of assets in adjacent Middle Eastern countries. Occidental had no presence in Africa, Asia, Europe or the former Soviet Union and its only South American presence was Colombia.
Following the exits, Occidental has retained a position in North Africa with the Algerian operations, although it had originally intended to exit this asset. This will provide a foundation if they choose to expand their footprint in Algeria, but operations there are similar in character to the existing portfolio in the middle east – Production Sharing Contracts (PSCs) with long life, low risk assets.
Occidental did add expertise in the Niobrara and Codell, with the DJ Basin assets and would have been able to deploy and to enhance its own expertise to Anadarko’s Delaware Basin asset. The big addition that comes from the merger is the additional of deep water production capability, a pre-requisite for operated roles in some of the world’s most exciting new basins. The degree to which deep water exploration and development capability has been transferred is less clear.; even before the merger this was an area that Anadarko had de-emphasized.
Again, the one that got away feels like Mozambique. Even retaining a small non-operated position would have provide an opportunity to learn the LNG business and once on production, provide an entry into LNG marketing. Aside from deep water production expertise, the merger does not seem to have done a lot to enhance Occidental’s capability.
Nor does not appear that the acquisition brought in assets that could benefit from Occidental’s existing skillset. Occidental have a differentiated capability in enhanced oil recovery and have experience with CO2, steam and heavy oil production. However, neither the DJ Basin nor the Algerian assets appear to benefit from this skillset and these techniques are not typically deployed in the US Gulf of Mexico.
Summary
The plot of Total Shareholder Return taken from Occidental’s latest 10-K filing and reproduced in Figure 2, below, suggests the Anadarko merger has been detrimental to Occidental’s shareholders. This chart depicts a company that was underperforming its peer group and then, in 2019, committed a blunder from which it has yet to recover.

Figure 2 - Total Shareholder Return Plot
The results of this analysis are a little more mixed. From a financial perspective the merger does add incremental cashflow at WTI prices above $45 per barrel. In that sense, the acquisition added value. However, there does not appear to have been a transformation in either asset mix or expanded capability and the merger did not bring in assets where Occidental could realize additional value through its own differentiated capabilities. The merger did serve to bulk Occidental up, but if the objective is more of the same, this can be achieved through individual asset deals at a much lower cost. Occidental ended up adding US onshore acreage, US Gulf of Mexico assets and a position in Algeria, which it may not have planned to keep, all of which are available through individual asset deals.
The acquisition does not look like a mistake of the magnitude suggested by Figure 2, but smaller asset deals over a longer period would probably have achieved the same objective at a lower cost – Occidental doubled production, but only increased cashflow from operations by 25% at $60 per barrel.
Oil Supply and Demand
Oil demand for 2021 has been revised upwards over the last month. The IEA (4) now estimates demand at 99.3 MMbbl/day in the final quarter of the year, just shy of 2019 levels, with full year average demand at 96.7 MMbbl/day.
On the supply side OPEC moved to expand production (5) at their meeting of April 1st, providing guidance through July, while maintaining their commitment to monitor and adjust as the market recovers. We expect actual production levels to be some way above these agreed levels, with the additional production coming from non-OPEC nations, and expect OPEC themselves to raise these production levels as we move into the summer. Our supply and demand forecast is shown in Figure 3.
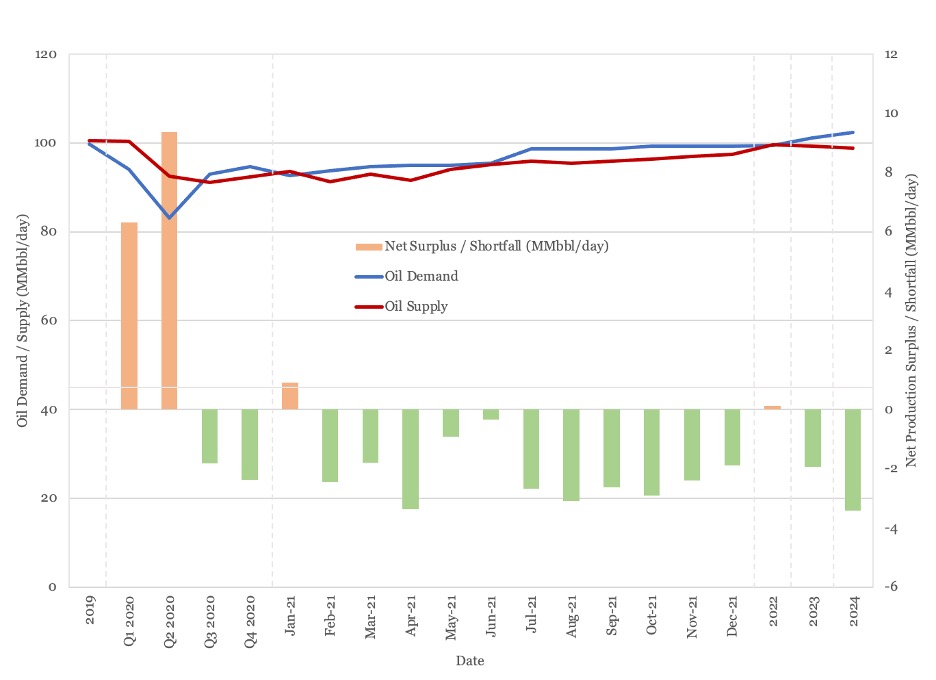
Figure 3 - Supply and Demand Surplus Forecast
We do not see OPEC moving to full capacity until 2022. We expect a continued supply deficit throughout the rest of 2021, with the market in balance in 2022 and a shifting to a growing deficit once demand growth returns in 2023 and beyond.
Oil Storage
We estimate global oil inventory drawdowns of 97 million barrels and 144 million barrels in the first and second quarter of 2021 respectively. Draws are forecast to continue at an average of 81 MMbbl/month for second half of 2021.
Figure 4 shows global storage capacity and inventories. With continued OPEC+ restraint and recovering demand, global inventories should return to long term average around the third quarter of this year and stay around that level through 2022. Beyond 2022, they are set to decline significantly in the absence of new investment.

Figure 4 - Global Storage Chart
Oil Prices
WTI has managed to keep its head above the $60/barrel mark for most of April and Brent has managed to do the same thing at the $65/barrel mark. Both Brent and WTI futures curves have moved upwards over the last month, with the sharpest increases seen over the near term.
Brent futures are now above $55/barrel out to 2028, while WTI futures are above $50/barrel out to 2032.
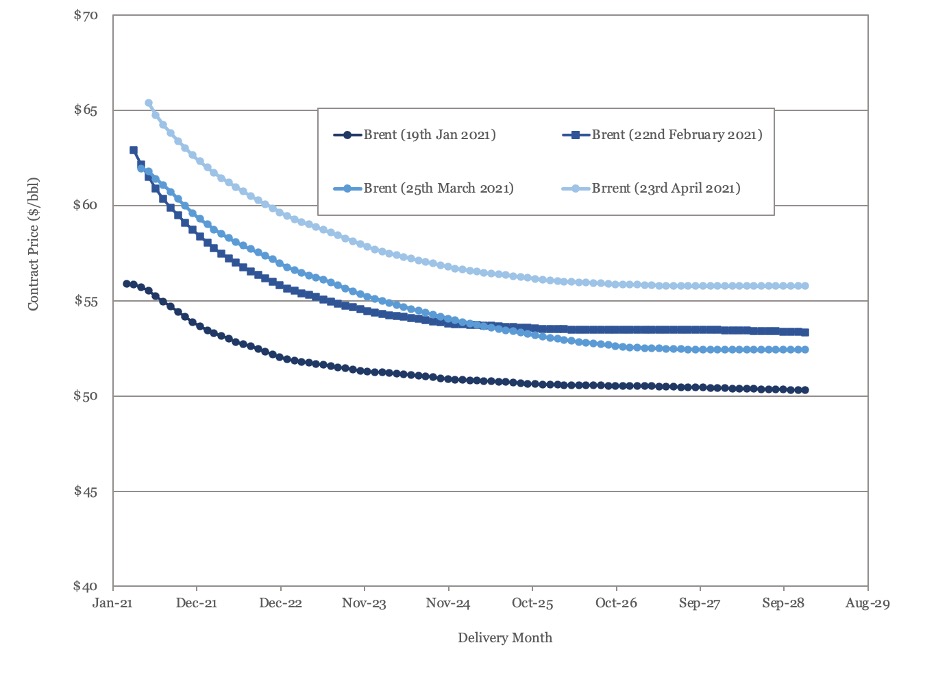
Figure 5 - Brent Crude Oil Futures
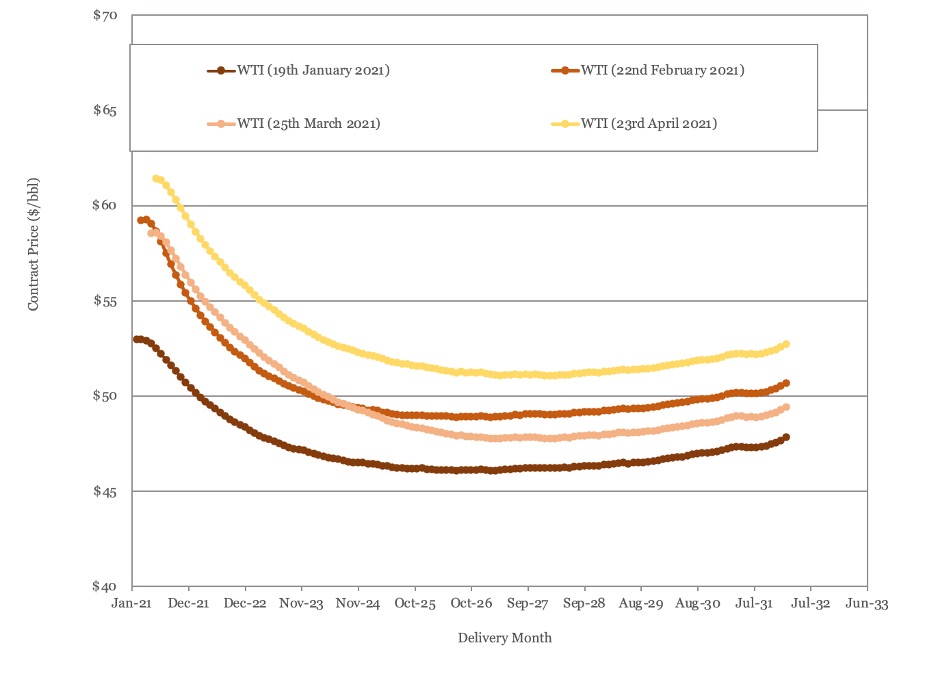
Figure 6 - WTI Crude Oil Futures
US Activity
US land oil rig counts continued to climb in March, rising from 312 on the 26th of March to 332 on the 23rd of April. The rate of rig count growth remains steady. Historic and forecast rig counts are shown in Figure 7.

Figure 7 - US Land Oil Rig Count
(1) Form 10-K, for the fiscal year ended December 31, 2018, Anadarko Petroleum Corporation
(2) Form 10-K, for the fiscal year ended December 31, 2018, Occidental Corporation
(3) Form 10-K, for the fiscal year ended December 31, 2020, Occidental Corporation
(4) IEA (2021), Oil Market Report - April 2021, IEA
(5) “15th OPEC and non-OPEC Ministerial Meeting concludes”, Organization of the Petroleum Exporting Countries, press release No. 10/2021, Vienna, Austria, 1st April 2021.


Oil Market Forecast - April 2021
Summary
This April edition of our Oil Market Forecast features a review of Occidental’s acquisition of Anadarko after their first full year together. This edition also sees OPEC+ issue a new supply schedule running through to July, showing an expansion in production, as the IEA raises its full year 2021 oil demand estimate.
A few key points:
- Occidental recorded a loss of nearly $16 billion dollars in 2020
- Occidental’s 2020 cashflow from operations, when recast for oil prices above $45 per barrel, shows improvement against its 2018 performance.
- With the exception of the US Gulf of Mexico, the acquisition appears to have increased Occidental’s size, rather than diversified its operations.
- The acquisition brought deep water production capability, but it isn’t clear to what degree exploration and development capability carried over. The exit from Mozambique LNG looks like a missed opportunity.
- Occidental’s production has doubled, while recast cashflow from operations at a WTI price of $60 per barrel has only increased by 25%. Several smaller asset acquisitions may have satisfied the same objective at a lower premium.
- We expect oil supply from OPEC+ nations to exceed the latest production schedule and the schedule to be relaxed further as the year progresses.
- We expect global oil storage to reach its long term average in the third quarter of the year and remain at around that level through 2022, before drawing down.
- Both Brent and WTI futures prices rose over the last month.
- US rig count continues to grow, but as yet, the growth rate does not show signs of acceleration.
Occidental – Anadarko Acquisition
Occidental’s $57 billion takeover of Anadarko was the largest oil and gas transaction of 2019, by an order of magnitude. It was notable at the time not just for its size, but for the manner in which it was conducted. Anadarko had agreed to a sale to Chevron before Occidental swooped in with a higher bid and Chevron declined to counter. The transaction closed on August 8th, 2019, meaning 2020 was the first full year for the combined entity.
We start with a brief history of Occidental and Anadarko and then look at the relative performance of the pre and post-acquisition entity through three lenses:
- Financial Performance
- Asset Mix
- Capability
The analysis is based on Occidental and Anadarko public filings between 2019 and 2021(1), (2), (3).
History
Anadarko was formed in 1959, as a subsidiary of the Panhandle East Corporation, to develop gas fields in the Anadarko basin in western Oklahoma and the Texas panhandle. It was spun off as an independent public company in 1986. Headquartered in the Woodlands, by 2018, Anadarko had grown to a company that produced more than 665,000 barrels of oil equivalent per day.
Anadarko consisted of an upstream and a midstream business. Upstream dominated, delivering over $ 11 billion in revenues in 2018 against $ 1.6 billion for midstream. The upstream business was US focused, with the US accounting for 86% of production volume and 79% of revenue in 2018.
US production was centered around Anadarko’s position in the DJ Basin, which accounted for more than 260,000 barrels of oil equivalent per day of production. It also held positions in the Powder River Basin, the Delaware Basin in the Permian, and a large deep water position in the US Gulf of Mexico, operating ten production facilities and participating in 34 fields. Anadarko had been an early pioneer in the US Gulf of Mexico, but by early 2018 its focus had shifted to the US onshore – in 2018 it drilled 2 exploration wells and 2.6 development wells on the Gulf of Mexico, compared to 17 exploration wells and 399.1 development wells in the US onshore.
The international business was similarly diverse, with production onshore Algeria and deep water Ghana and exploration in Canada, Colombia, Peru, and South Africa. Anadarko also operated and LNG scale gas discovery in Mozambique, which was still in the pre-FID stage in 2018.
Occidental was formed in California in 1920. By 2018 it was headquartered in Houston and had large upstream, midstream and chemicals business. Occidental was larger in revenue terms, but with a similar size of upstream business to Anadarko, with 2018 production of 658,000 barrels of oil equivalent per day contributing $ 10 billion of Occidental’s $17 billion in revenue for the year.
Occidental had a more international upstream business than Anadarko, with its international operations providing nearly 50% of production. It was also a lot more focused. Its US business was built on two companies in the Permian basin – Permian Resources, which developed shale oil fields and Permian EOR, which recovered oil from conventional fields using CO2 injection. The international business was similarly focused – heavy oil in Oman and Colombia and gas in the UAE and Qatar. Occidental did not have any deep water or LNG exposure.
Financial Performance
In as much as the oil & gas industry has a normal year, 2020 was not it. Occidental suffered the same asset impairments as everyone else, reporting a full year loss for 2020 of nearly $16 billion. Low commodity prices impose a double penalty on oil & gas companies, as not only do they see reduced revenue, but they are also forced to re-state their reserves, imposing large non-cash charges. Consequently, the approach taken in assessing financial performance here is to consider cashflow from operations rather than net income, with revenue from upstream oil & gas recast for a range of oil prices.
This provides a picture of cash generative capacity of the company incorporating both cost structure and interest payments, normalized for a range of oil prices. This approach can be employed with oil & gas companies as changes in commodity prices fall (mainly) to the bottom line. Mainly, because some fiscal regimes do vary the state share levied with price, which would have an impact on the results.
The disadvantages are that this approach does not consider capital investment or financing required to maintain the business and that the enterprise down approach is far less rigorous than performing the same analysis on an asset or contract level. Not does it consider how fluctuations in commodity price would affect midstream or chemicals business.
The key benefit of the approach in this case is that the analysis is straightforward and can be completed using public data. The analysis was conducted based on Occidental at the end of 2018 and Occidental at the end of 2020 for West Texas Intermediate (WTI) prices between $40/barrel and $80/barrel. The plot of cashflow from operations for both cases is shown in Figure 1, below.
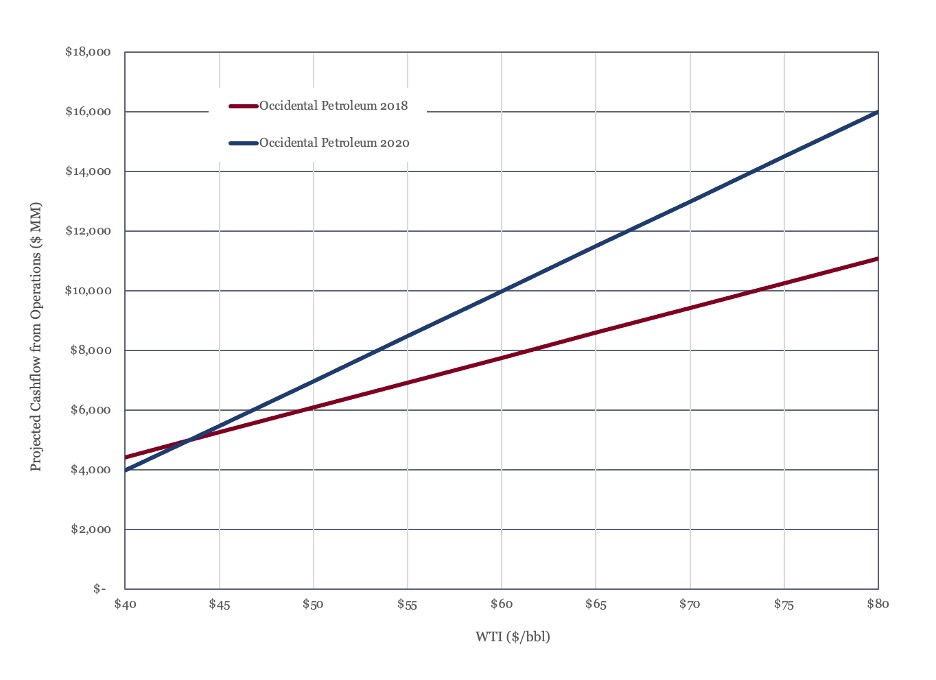
Figure 1 - Recast Cashflow from Operations vs Oil Price
As Figure 1 shows, the cash generative capacity of Occidental, post-merger is greater than the cash generative capacity of the firm pre-merger for WTI prices above $45 per barrel. At $60 per barrel, the combined entity generates $ 2 billion more per year in cashflow than pre-merger Occidental, a 25% increase. This is due to the incremental revenue from increased production outstripping the incremental cost of production, overhead and debt interest at prices above $45 per barrel. From a cashflow perspective, at least, the acquisition seems to have improved Occidental’s position.
Asset Mix
The pre-acquisition Occidental was a very focused company. There was little overlap with Anadarko, with Anadarko’s smaller position in the Delaware Basin the only shared geography. Occidental made some immediate moves to trim parts of the portfolio. The earliest exit was the sale of its stake in Mozambique LNG and its South African assets to Total in 2019. This deal originally included the Algeria and Ghana assets, but these were excluded after the Algerian government blocked the sale. The Ghana assets were put back on sale in 2020 and at the time of writing it reported they may be acquired by a Carlyle backed entity. It has exited its Colombian heavy oil assets and other international exploration positions, except for Colombia.
Occidental reported proved reserves of 2.9 billion barrels of oil equivalent in 2020, up from 1.9 billion barrels of oil equivalent in 2018. Production for 2020 was reported at 1,326,027 barrels of oil equivalent per day, just over the combined 2018 Occidental and Anadarko production from 2018. This is quite remarkable given that Occidental imposed the same investment cuts as the rest of the industry in 2020.
Occidental, as an enterprise, became more dependent on upstream oil and gas and much more focused on the United States, accounting for neatly 80% of production in 2020 as opposed to 57% in 2018. It also became gassier, with gas accounting for 29% of production in 2020 against 24% in 2024.
The only one of Anadarko’s non-US producing assets that Occidental has retained is the interest in Algeria. From an asset perspective, this kind of long life, low technical risk, Production Sharing Contract (PSC) is similar to Occidental’s existing Middle Eastern portfolio.
The DJ Basin assets have similar performance characteristics to the Permian business – they avoid exploration risk and enjoy short development cycles but have high capital intensity and steep production declines. The only real change to Occidental’s asset mix was the retention of Anadarko’s deep water Gulf of Mexico business. This is a business that requires occasional injections of large amounts of capital but can be very profitable with the right assets and high oil prices. It is still not clear what Occidental intend for the Gulf of Mexico business.
The US Gulf of Mexico aside, the post-acquisition Occidental looks like more of a bulked up, US centric version of the original. The decision to exit Ghana is understandable as in country production was no longer material for a company of Occidental’s size. The decision to exit Mozambique, while it was probably forced on Occidental by the financial reality of both the need to finance the merger and ongoing capital commitments, looks like more of a missed opportunity. Maintaining some form of non-operated minority position would have given Occidental an opportunity to learn and exposure to the business.
Capability
The pre-acquisition Occidental had an established shale oil capability through its large position in the Permian. It had established a differentiated capability in Enhanced Oil Recovery (EOR), through its Permian CO2 flood business as well as steam floods in Oman and heavy oil in Colombia. It appeared to be a company that favored large, long life assets with low exploration risk where it could focus on improving recovery. It had material gas production in the UAE and Qatar and complimentary midstream businesses to handle associated liquids.
The asset mix and activity spread suggests a company that avoided conventional exploration and grew through acquisition and enhancing recovery in material, discovered fields. There was no deep water capability and no LNG experience. The geographic footprint was also very tight – even overseas it was a cluster of assets in adjacent Middle Eastern countries. Occidental had no presence in Africa, Asia, Europe or the former Soviet Union and its only South American presence was Colombia.
Following the exits, Occidental has retained a position in North Africa with the Algerian operations, although it had originally intended to exit this asset. This will provide a foundation if they choose to expand their footprint in Algeria, but operations there are similar in character to the existing portfolio in the middle east – Production Sharing Contracts (PSCs) with long life, low risk assets.
Occidental did add expertise in the Niobrara and Codell, with the DJ Basin assets and would have been able to deploy and to enhance its own expertise to Anadarko’s Delaware Basin asset. The big addition that comes from the merger is the additional of deep water production capability, a pre-requisite for operated roles in some of the world’s most exciting new basins. The degree to which deep water exploration and development capability has been transferred is less clear.; even before the merger this was an area that Anadarko had de-emphasized.
Again, the one that got away feels like Mozambique. Even retaining a small non-operated position would have provide an opportunity to learn the LNG business and once on production, provide an entry into LNG marketing. Aside from deep water production expertise, the merger does not seem to have done a lot to enhance Occidental’s capability.
Nor does not appear that the acquisition brought in assets that could benefit from Occidental’s existing skillset. Occidental have a differentiated capability in enhanced oil recovery and have experience with CO2, steam and heavy oil production. However, neither the DJ Basin nor the Algerian assets appear to benefit from this skillset and these techniques are not typically deployed in the US Gulf of Mexico.
Summary
The plot of Total Shareholder Return taken from Occidental’s latest 10-K filing and reproduced in Figure 2, below, suggests the Anadarko merger has been detrimental to Occidental’s shareholders. This chart depicts a company that was underperforming its peer group and then, in 2019, committed a blunder from which it has yet to recover.
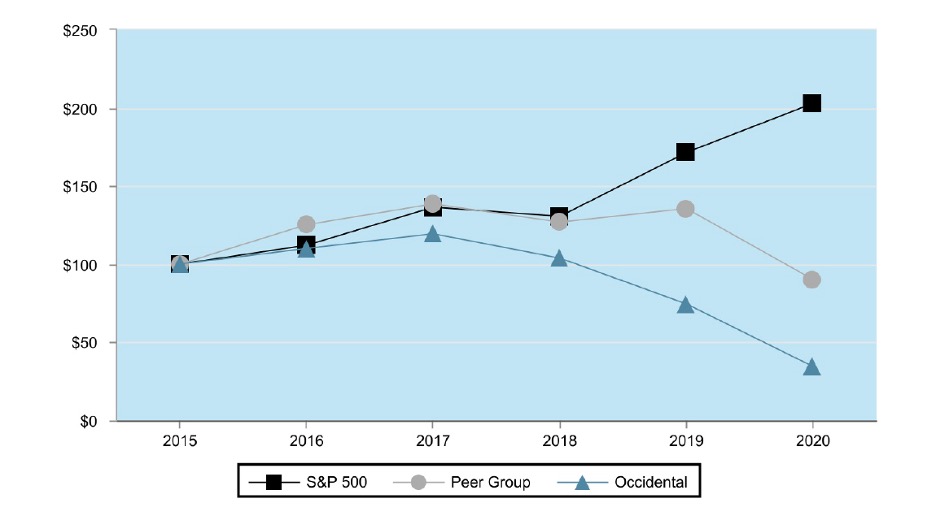
Figure 2 - Total Shareholder Return Plot
The results of this analysis are a little more mixed. From a financial perspective the merger does add incremental cashflow at WTI prices above $45 per barrel. In that sense, the acquisition added value. However, there does not appear to have been a transformation in either asset mix or expanded capability and the merger did not bring in assets where Occidental could realize additional value through its own differentiated capabilities. The merger did serve to bulk Occidental up, but if the objective is more of the same, this can be achieved through individual asset deals at a much lower cost. Occidental ended up adding US onshore acreage, US Gulf of Mexico assets and a position in Algeria, which it may not have planned to keep, all of which are available through individual asset deals.
The acquisition does not look like a mistake of the magnitude suggested by Figure 2, but smaller asset deals over a longer period would probably have achieved the same objective at a lower cost – Occidental doubled production, but only increased cashflow from operations by 25% at $60 per barrel.
Oil Supply and Demand
Oil demand for 2021 has been revised upwards over the last month. The IEA (4) now estimates demand at 99.3 MMbbl/day in the final quarter of the year, just shy of 2019 levels, with full year average demand at 96.7 MMbbl/day.
On the supply side OPEC moved to expand production (5) at their meeting of April 1st, providing guidance through July, while maintaining their commitment to monitor and adjust as the market recovers. We expect actual production levels to be some way above these agreed levels, with the additional production coming from non-OPEC nations, and expect OPEC themselves to raise these production levels as we move into the summer. Our supply and demand forecast is shown in Figure 3.

Figure 3 - Supply and Demand Surplus Forecast
We do not see OPEC moving to full capacity until 2022. We expect a continued supply deficit throughout the rest of 2021, with the market in balance in 2022 and a shifting to a growing deficit once demand growth returns in 2023 and beyond.
Oil Storage
We estimate global oil inventory drawdowns of 97 million barrels and 144 million barrels in the first and second quarter of 2021 respectively. Draws are forecast to continue at an average of 81 MMbbl/month for second half of 2021.
Figure 4 shows global storage capacity and inventories. With continued OPEC+ restraint and recovering demand, global inventories should return to long term average around the third quarter of this year and stay around that level through 2022. Beyond 2022, they are set to decline significantly in the absence of new investment.
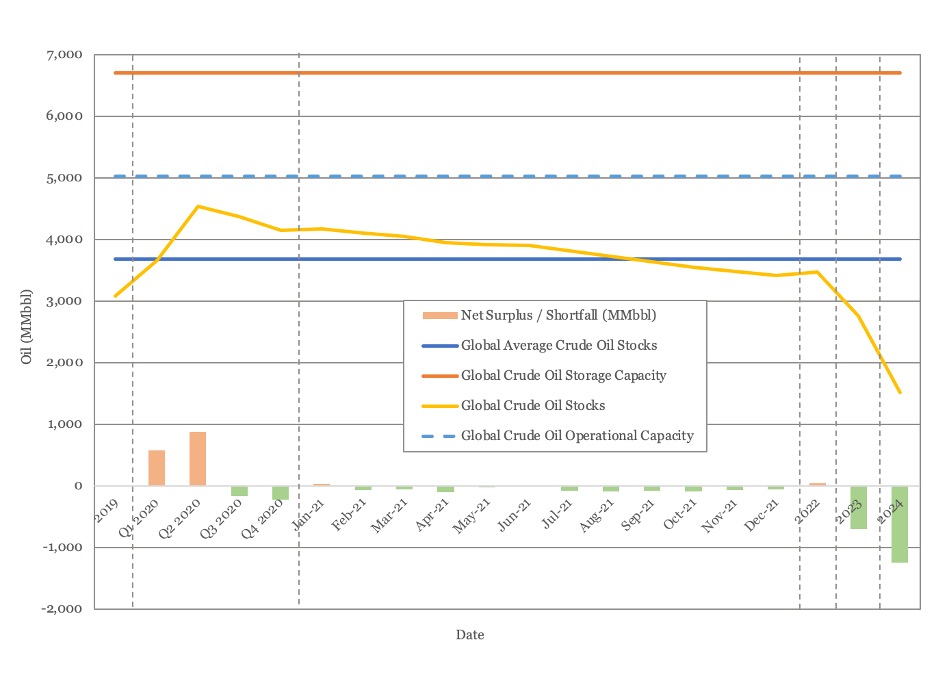
Figure 4 - Global Storage Chart
Oil Prices
WTI has managed to keep its head above the $60/barrel mark for most of April and Brent has managed to do the same thing at the $65/barrel mark. Both Brent and WTI futures curves have moved upwards over the last month, with the sharpest increases seen over the near term.
Brent futures are now above $55/barrel out to 2028, while WTI futures are above $50/barrel out to 2032.

Figure 5 - Brent Crude Oil Futures

Figure 6 - WTI Crude Oil Futures
US Activity
US land oil rig counts continued to climb in March, rising from 312 on the 26th of March to 332 on the 23rd of April. The rate of rig count growth remains steady. Historic and forecast rig counts are shown in Figure 7.
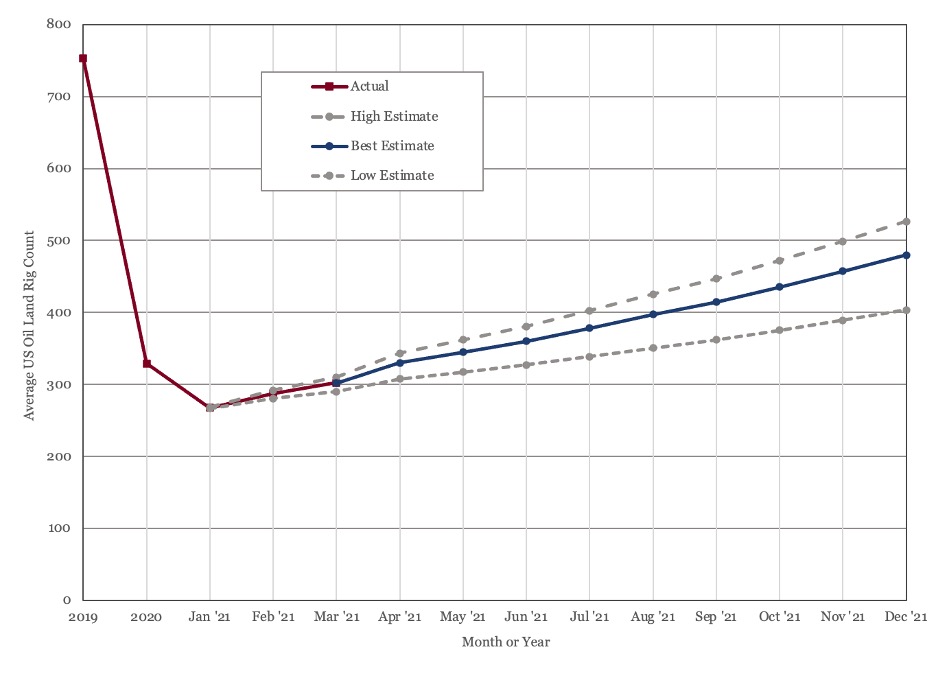
Figure 7 - US Land Oil Rig Count
(1) Form 10-K, for the fiscal year ended December 31, 2018, Anadarko Petroleum Corporation
(2) Form 10-K, for the fiscal year ended December 31, 2018, Occidental Corporation
(3) Form 10-K, for the fiscal year ended December 31, 2020, Occidental Corporation
(4) IEA (2021), Oil Market Report - April 2021, IEA
(5) “15th OPEC and non-OPEC Ministerial Meeting concludes”, Organization of the Petroleum Exporting Countries, press release No. 10/2021, Vienna, Austria, 1st April 2021.


Explore Our Services

Business Development
Oil & Gas an extractive industry, participants must continuously find and develop new oil & gas fields as existing fields decline, making business development a continuous process.

Strategy
We approach strategy through a scenario driven assessment of the client’s current portfolio, organizational competencies, and financial framework. The strategy defines portfolio actions and coveted asset attributes.
Origination
Deal origination consists of identifying coveted assets, assets with attributes consistent with the client’s strategy, and qualified buyers. We advocate a proactive approach to business development and will undertake outreach on our client’s behalf.
Transaction Support
Transaction support consists of in depth asset evaluation, negotiation of commercial agreements or preparation of license round submission and close out of conditions. We can also aid in joint venture set up and management and asset maturation as required.