Oil Market Forecast - January 2022
Summary
The oil market made a great start to the year, with prices hitting their highest levels since 2014 as concerns about Omicron receded. In this month’s Oil Market Forecast we will explore some of the uncertainties around oil supply and lay out our scenarios for US shale activity in the coming year.
A few key points:
- The consensus across agencies is that the impact of Omicron on oil demand will be less than originally feared, with both IEA and EIA raising their demand forecasts.
- Evidence continues to mount over recent months that OPEC+ nations are struggling to reach their production targets. A lack of upstream investment over recent years could result in tightening oil supply later this decade.
- There remains a question mark over how the US shale industry will respond to higher prices, and the capacity of the oilfield services industry to respond to increased activity levels.
- In our view, the oil market looks fairly balanced over the next couple of years.
- Oil prices hit their highest levels since 2014; both Brent and WTI futures curves sit comfortably above their 2021 highs.
- The US land oil rig count reached 471; our best estimate is that it will average 490 for 2022.
Oil Supply and Demand
The consensus of the three main forecasting agencies appears to be that the emergence of the Omicron variant will have much less impact on oil demand than initially feared. The IEA (1) upgraded their 2021 and 2022 demand estimates by 200,000 bbl/day to 96.6 MMbbl/day and 99.9 MMbbl/day in 2021 and 2022 respectively. The EIA (2) added 100,000 bbl/day to its 2022 estimate, bringing in to 100.5 MMbbl/day. OPEC (3), who did not adjust their demand estimates down last month, did not adjust them up this month, holding them flat at 97.7 MMbbl/day and 100.6 MMbbl/day in 2021 and 2022 respectively. Beyond 2022 all three agencies are predicting demand growth, at least through the middle of the next decade. The EIA is predicting an additional 1.75 MMbbl/day of demand in 2023. At nearly 2%, this is above recent historical growth rates, suggesting there will still be some demand catch up next year as air travel moves closer to pre-pandemic norms.
If the demand outlook is steady, the supply outlook is more of a moving target. The prospect of a large-scale return of Iranian crude to market has receded, as the Iran nuclear talks appear deadlocked. Instead, uncertainty stems from concerns over the ability of OPEC+ nations to meet their quotas and the assumption that US production will respond to price signals as it has historically.
To address OPEC+ production capacity first, there were a series of reports towards the end of last year that the OPEC+ group of nations were unable to meet their production targets. The New York Times (4) reported that OPEC+ production fell short of its quota by 650,000 bbl/day in November 2021 and the Wall Street Journal (5) reported a production shortfall of 790,000 bbl/day in December 2021. The New York times reports that, of the large OPEC+ producers, Nigeria, Angola and even Russia are struggling to meet their quotas, with the IHS quoted as saying that Russia has hit a production wall at 9.9 MMbbl/day and will require tax changes or new investment to raise production beyond that level. Russian capacity is one of the most contentious areas in this debate, as last year’s production data tends to bear out the struggle that Nigeria and Angola have had but suggests that Russia is ready to return to pre-pandemic capacity. Indeed, Platts (6) reported that Russia is prepared to return to pre-pandemic production in May this year and both the IEA and EIA are forecasting Russian production in the 11.5 MMbbl/day – 12 MMbbl/day range for 2022.
What would cause this difficulty to return oil production to market and are these concerns credible? The following chart is taken from the IEA’s Oil 2021 report (7), and shows historical upstream CAPEX spend since its peak, in 2014.

Figure 1 - Historical Upstream CAPEX Spend
Figure 1 shows upstream investment running at just over 50% of historic levels since 2016, and at just under 50% over the last couple of years. In 2014, supply growth was outstripping demand growth, so perhaps this is the appropriate level of expenditure in a ~ 1% demand growth world. It is hard to know, because of the nature of the industry and cycle times. How long does it take to find and develop a conventional hub class oil field, going from acreage acquisition to first oil? It depends, but eight years would be an optimistic assessment. Of those eight years, three to four years would be spent in execution, when contracts are let, and CAPEX committed; so, past the point of not return. There is more flexibility to exit or defer development of fields that are earlier in the lifecycle – exploration, appraisal, concept selection or even FEED. This means that supply will start to lag four our more years after investment levels are cut, and it will accelerate for some time as there will be a lack of fields in the earlier stages of maturation to bring forward for execution. A recent report from Rystad (8), where they calculate oil & gas discoveries in 2021 will be at their lowest level in 75 years, tends to bear this out. It certainly looks possible that the next few years could see tightening supplies because of years of underinvestment. This is no means certain, however. The IEA, in the same Oil 2021 report, predict that OPEC+ spare capacity will be higher through the first half of the 2020’s than it was through the second half of the 2010’s.
If there is a concern over the ability of conventional international supply to meet rising demand, what about the response of US shale? Here the consensus among the IEA, EIA and OPEC is that 2022 will see a surge in US activity and record US production. We are not so sure that that is the case. Historically, if you look at the way US investment has responded to price, then we should see a huge ramp up in rig and completion spread counts and a consequent surge in US production. This time, however, it might be different.
The last couple of years has seen a change in the contract between investor and operator. Instead of growth, the focus has shifted to returns - keep production flat, activity levels steady, pay down debt and return the rest to investors. Consequently, the US shale industry is less likely to respond to price signals than in prior years.
What would happen if that discipline broke down? In their November Drilldown podcast (9), Richard and John Spears of Spears and Associates, described an oilfield services industry operating at full capacity. Their view is that all available equipment is currently under contract, and so to expand capacity further would require capital investment, something the oilfield services industry will be reluctant to undertake speculatively. These firms would require multi-year contracts, guaranteeing a return on that capital investment, something that the smaller operating companies that have made up most incremental activity would be unable to underwrite. This creates a dynamic where CAPEX increases will be restrained in one way or another; the operators will be restrained by their investors, and if that restraint fails then by the capacity of the oilfield services industry to execute the work.
Where does this leave us? Our view is that OPEC+ production will continue rise throughout the year but will continue to lag target production levels. In terms of US production, we are more bullish in our December forecast; we expect the US to add ~ 400,000 barrels/day by year end, but don’t see the US setting new production records in the next couple of years. This gives a supply and demand balance, as shown in Figure 2, that runs a slight deficit through 2022 and 2023.

Figure 2 - Supply and Demand Surplus Forecast
Either stronger production growth by OPEC+, or higher US shale activity would be enough to flip this balance to a surplus over the next couple of years, which would be in line with the IEA forecast. Conversely any supply shock, a terrorist attack in the Middle East, or a drop in Russian supply in retaliation to sanctions, would be enough to push the balance to a sharp deficit.
Oil Storage
We estimate global oil inventory drawdowns of 356 MMbbl in 2021, following a build of 1,027 MMbbl in 2020. With this month’s higher estimates for 2022 demand and a growing OPEC+ production shortfall, we expect a drawdown of 131 MMbbl for 2022. Figure 3 shows global storage capacity and inventories. If supply and demand follow the current forecast, global inventories should sit around the five-year average for 2022 to 2023.
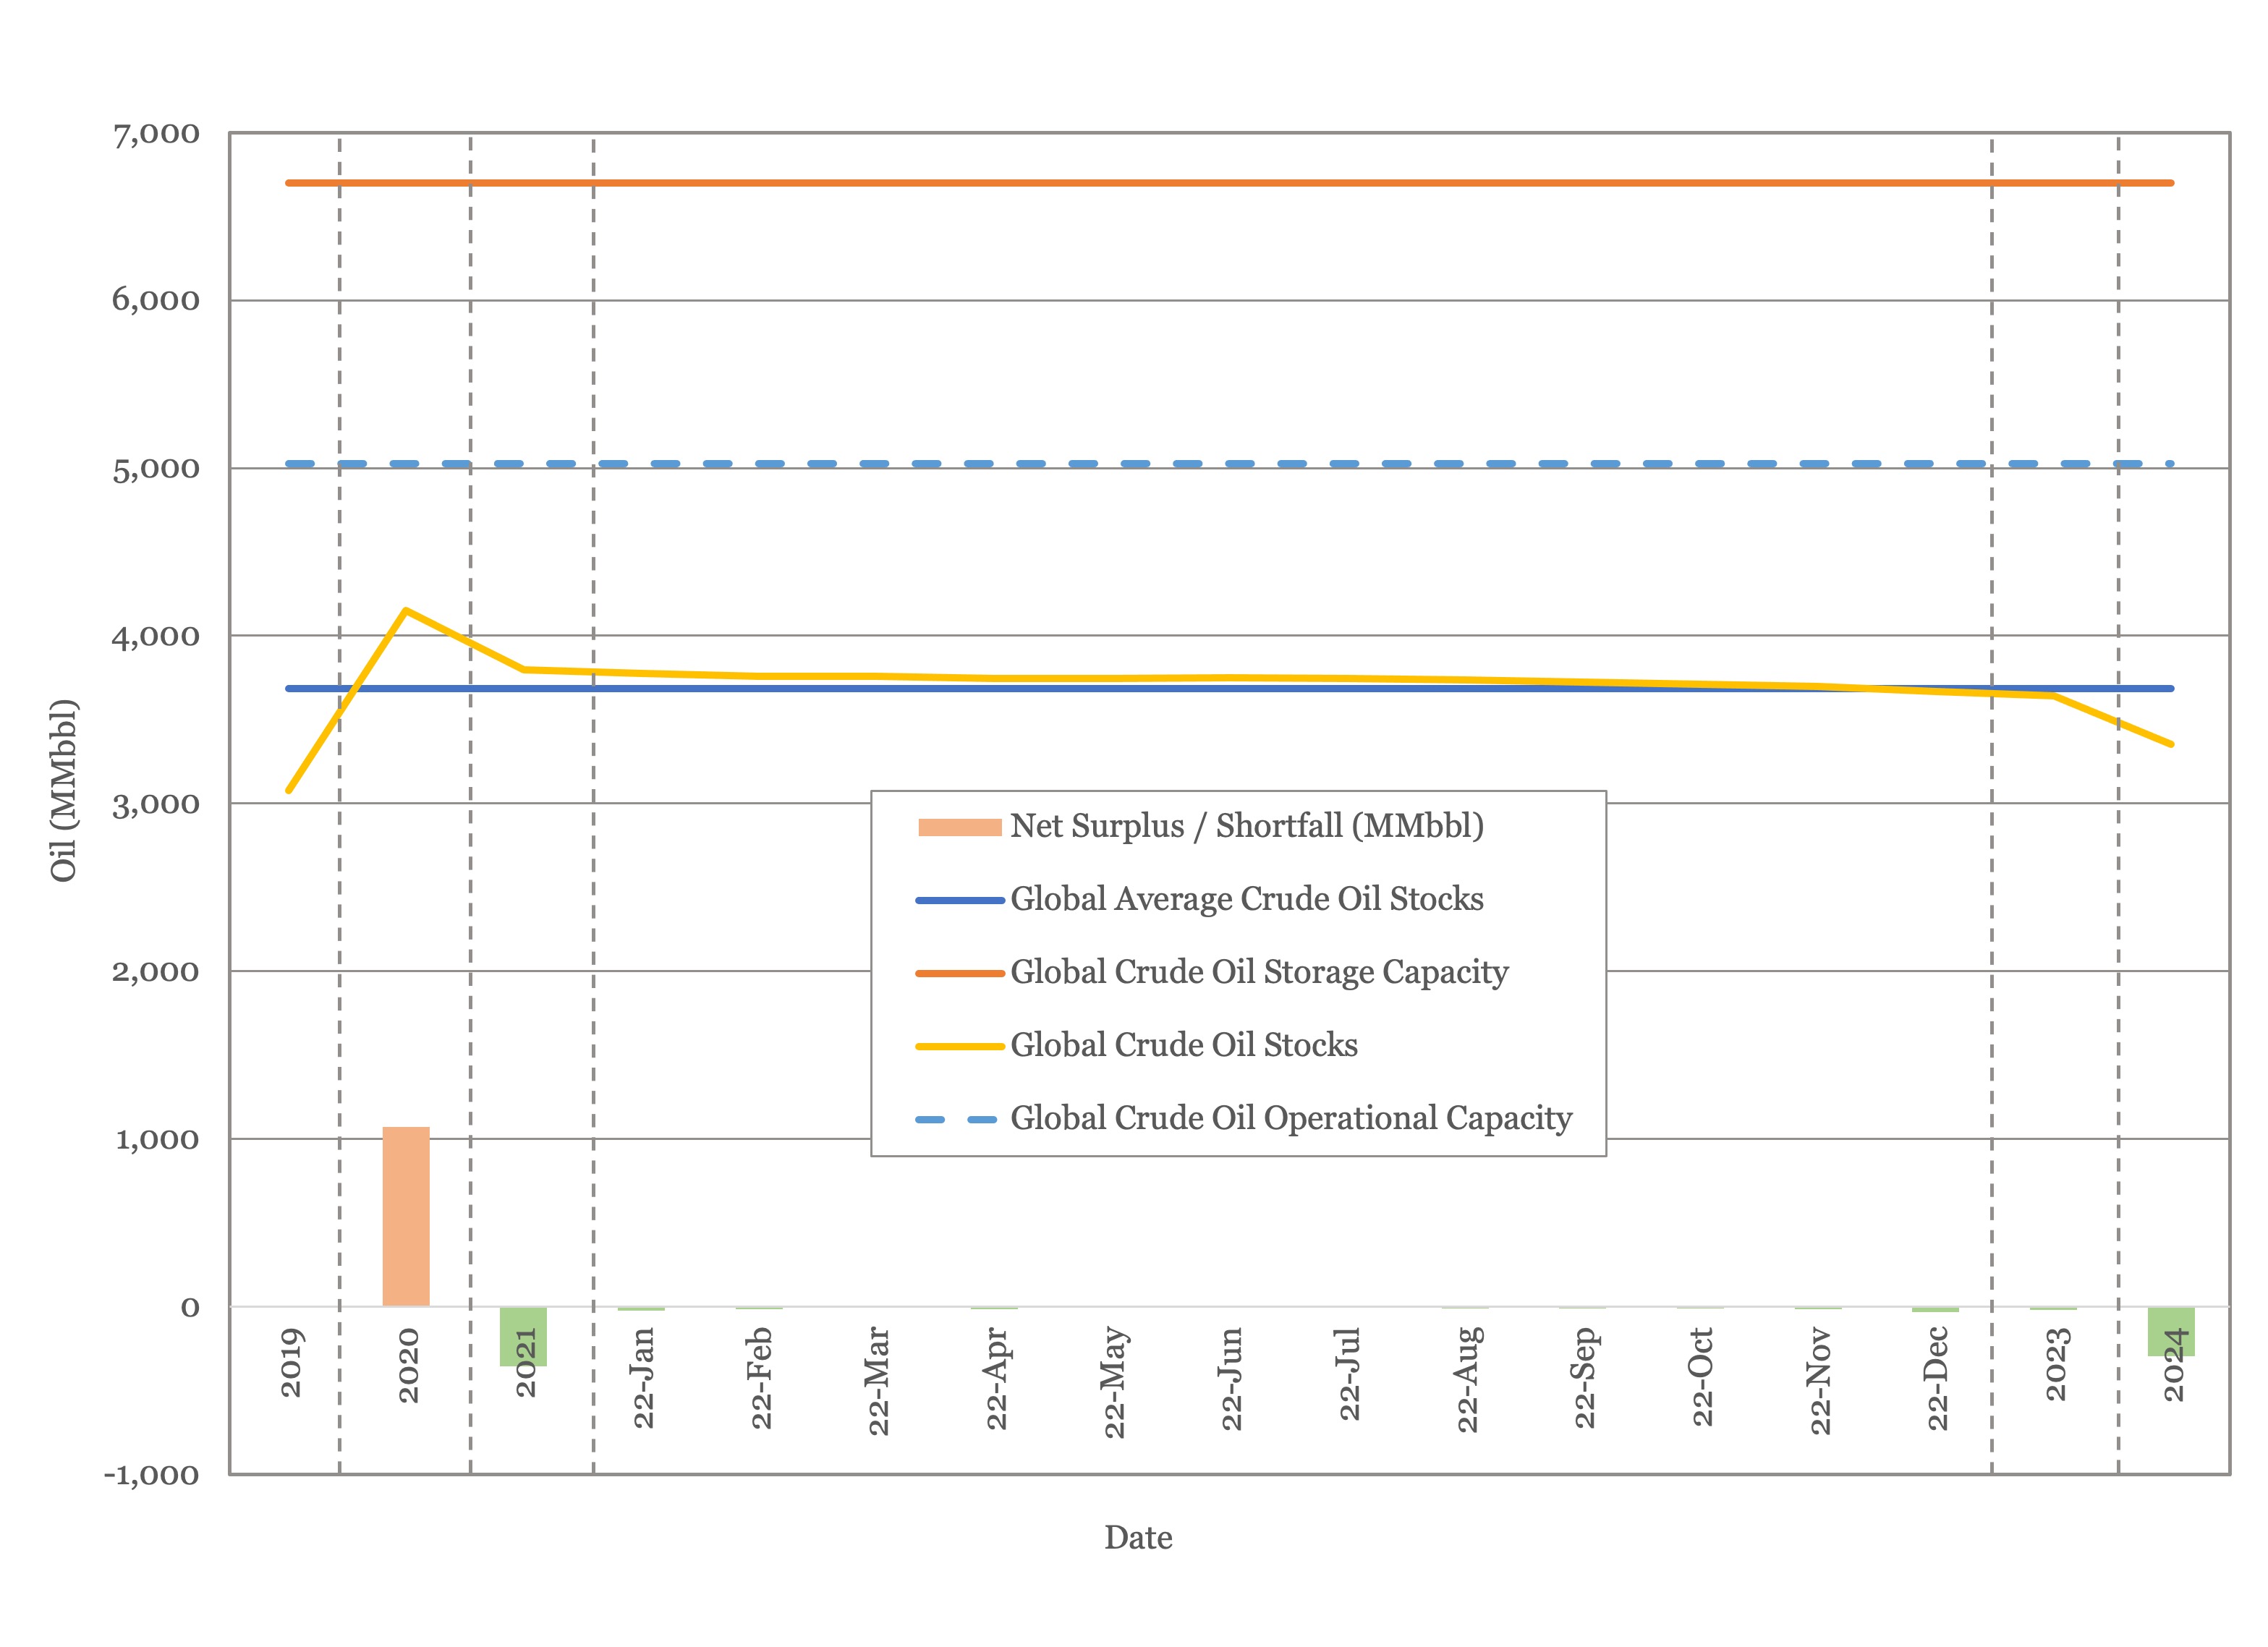
Figure 3 - Global Storage Chart
Oil Prices
Oil prices surged this month as concerns about the impact of Omicron receded with both Brent and WTI touch their highest levels since 2014, at just over and just under $88/bbl respectively. The EIA and Standard Chartered (10) raised their estimates for Brent to $75 for the year, the Economist (11) estimated $79/bbl, and Goldman Sachs (12) came in on top at $96/bbl.
Both Brent and WTI futures rose; at the time of writing both are above their 2021 highs. Brent is above $70/bbl out to 2025, with WTI above $60/bbl for the next decade.
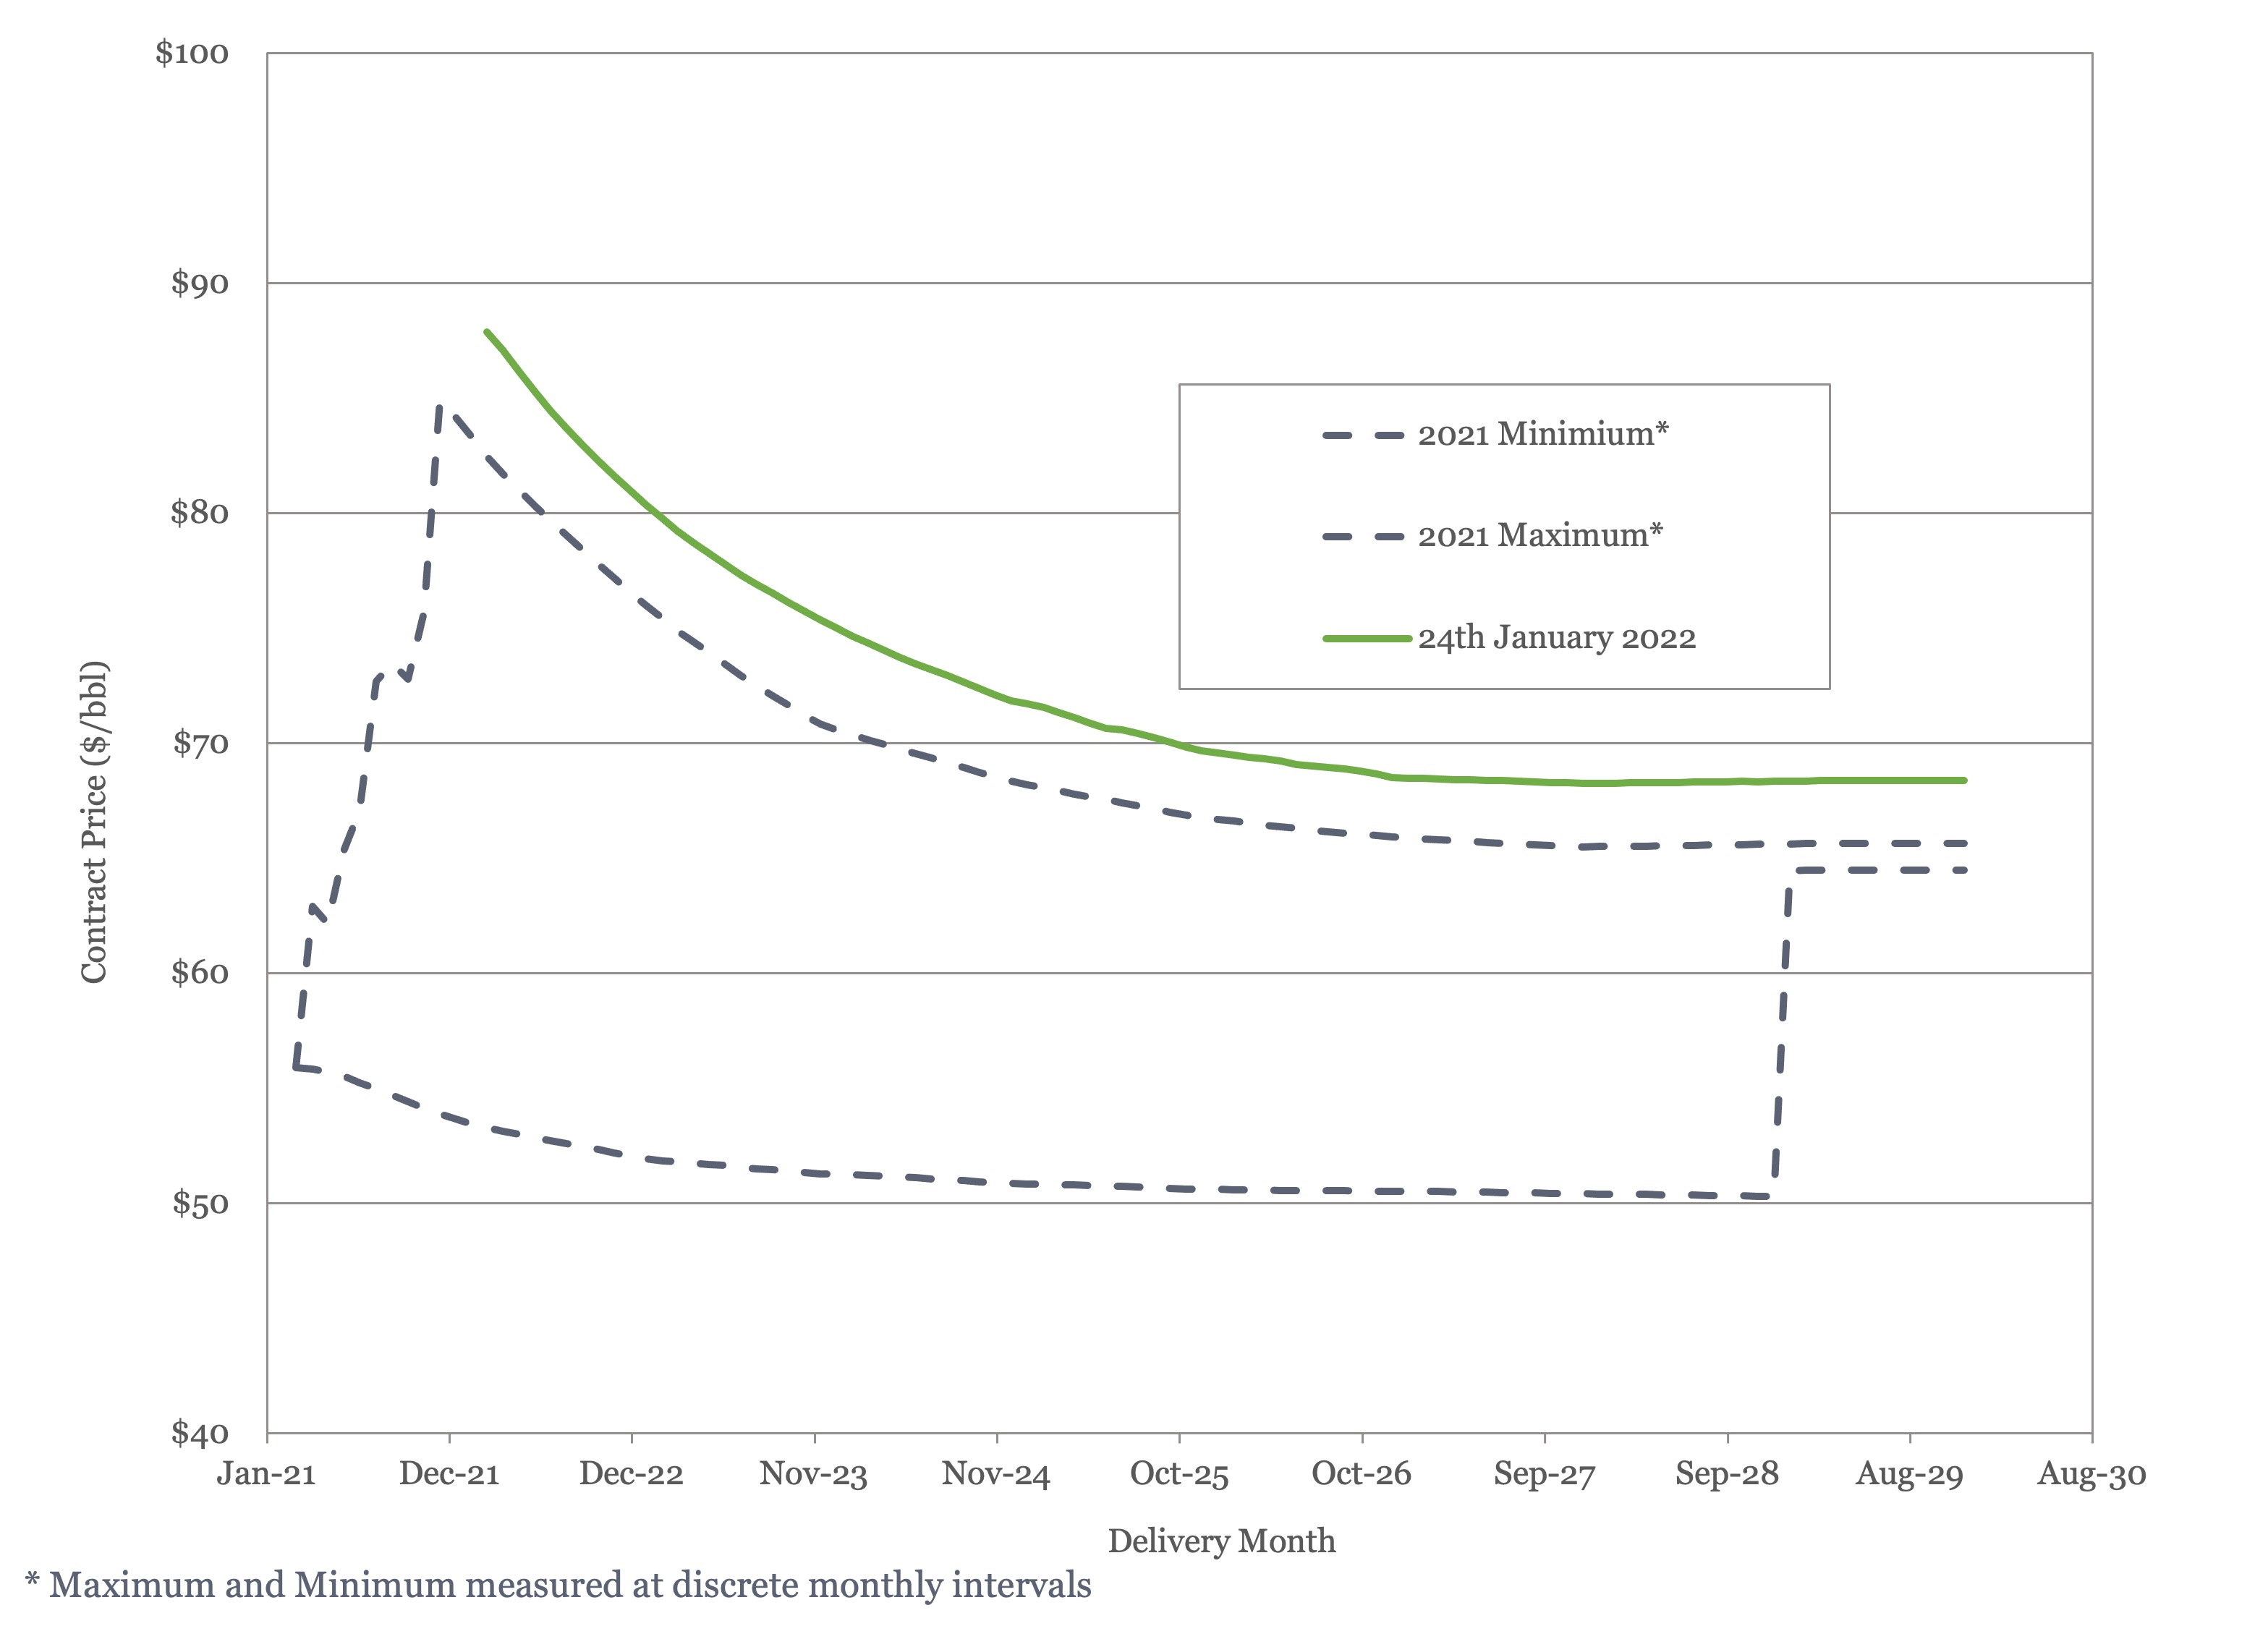
Figure 4 - Brent Crude Oil Futures

Figure 5 - WTI Crude Oil Futures
With the oil market roughly in balance and demand recovering slowly, it appears that these price increases are being driven by heightened geopolitical concerns in the Middle East and Europe.
US Activity
The US land oil rig count stood at 471 on the 21st of January, down by one from the week before. Our best estimate of average land oil rig count for the year is 490, which would be consistent with a 35% increase in activity level over 2021 and implies a small increase in rig count over the year and consistent with ~ 400,00 bbl/day of additional US production. Our low case is based on a 20% activity level increase over 2021, which would see an average land oil rig count of 435 for the year, implying a fall in rig counts as the year progresses. Our high case, which is consistent with the activity levels that we think would be required to boost US production to levels that the IEA, EIA, and OPEC forecast, would see an average land oil rig count for the year of 585; suggesting that rig counts would return to close to 700 by year end.
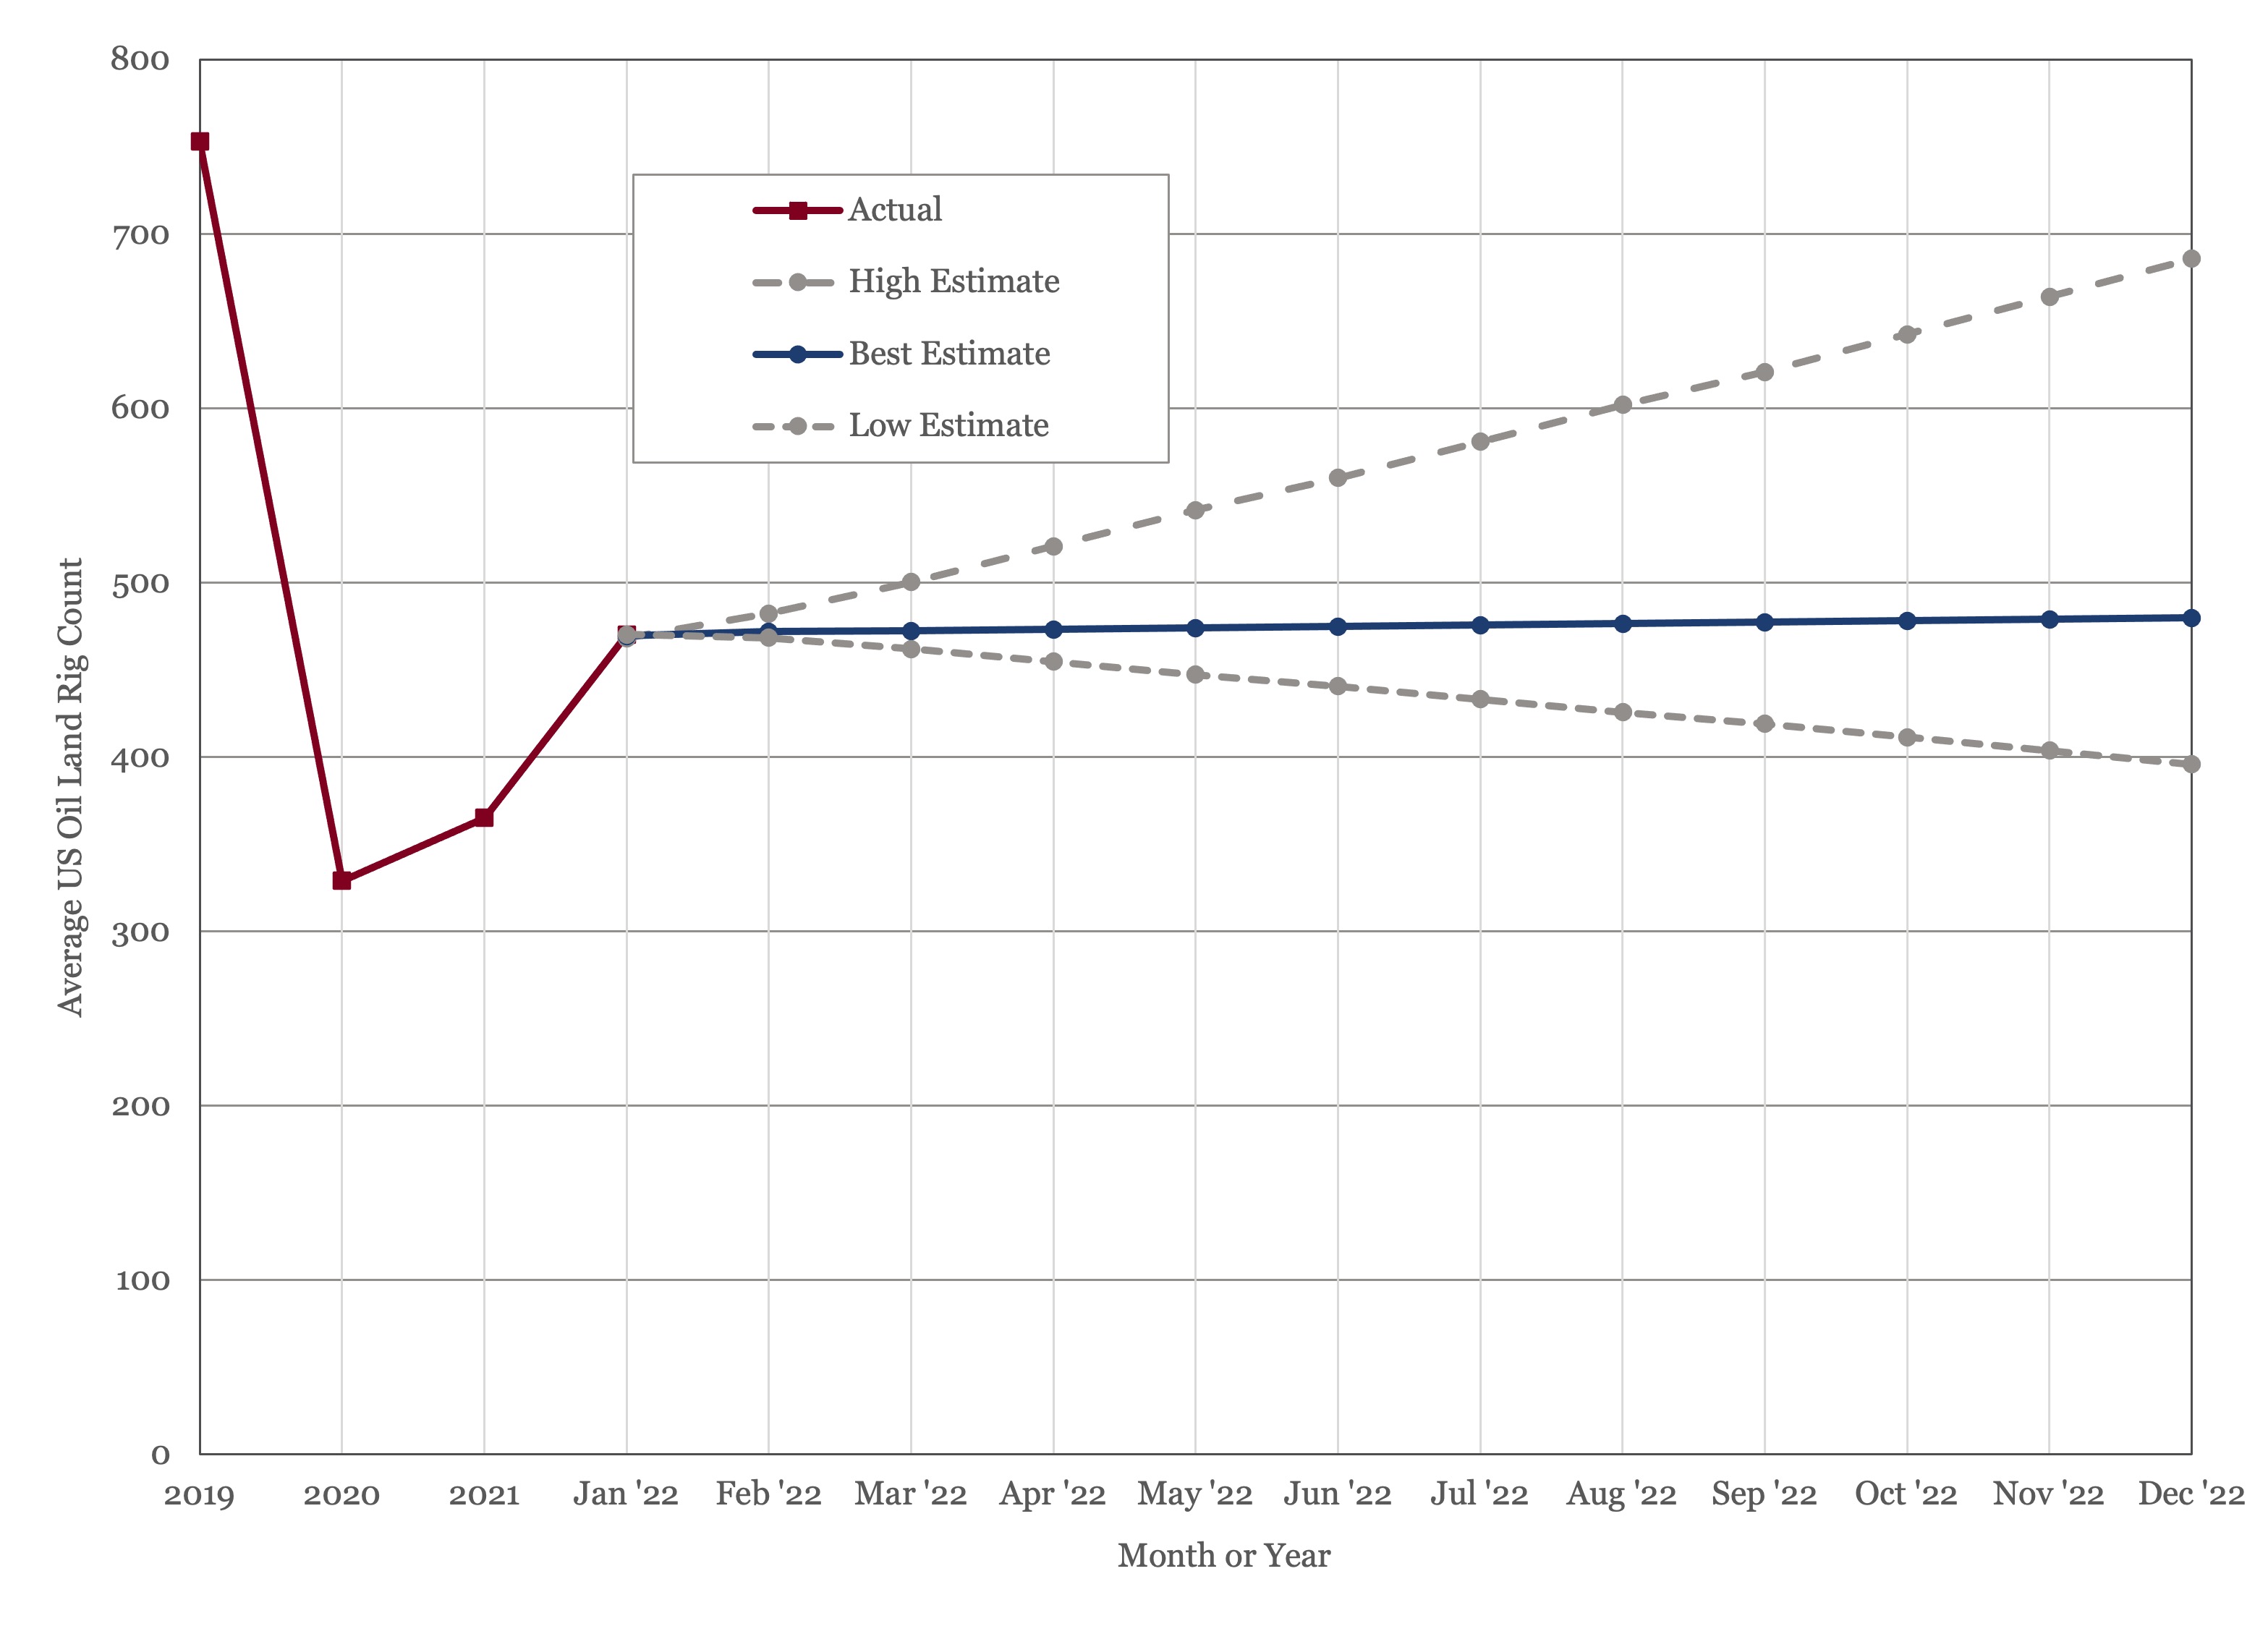
Figure 6 - US Land Oil Rig Count
(1) Oil Market Report – January 2022, IEA, Paris.
(2) Short Term Energy Outlook (STEO), January 6th, 2022, U.S. Energy Information Administration.
(3) “OPEC Monthly Oil Market Report”, Organization of the Petroleum Exporting Countries, January 18th, 2022.
(4) “OPEC and Russia agree to increase oil output amid lagging production.”, Stanley Reed, New York Times, January 4th, 2022.
(5) “Oil Demand to Exceed Pre-Covid Levels in 2022, IEA Says”, Will Horner, Wall Street Journal, January 19th, 2022.
(6) “Russia's 2021 oil output up 2.4% on year on increased OPEC+ quotas”, Rosemary Griffin, S&P Global Platts, January 2nd, 2022.
(7) “Oil 2021”, IEA, 2021, Paris
(8) “Global oil and gas investments to hit $628 billion in 2022, led by upstream gas and LNG”, January 11th, 2022, Rystad Energy
(9) “EP214: Point-Counterpoint: Part 2”, The Drilldown: In Depth Answers to Oilfield Questions, November 16th, 2021, Spears and Associates
(10) “Standard Chartered Sees $100+ Oil”, Andreas Exarheas, Rigzone, January 13th, 2022.
(11) “The World Ahead 2022”, The Economist
(12) “Goldman Sachs Sees $105 Oil in 2023”, Tsvetana Paraskova, OilPrice.com, January 18th, 2022.


Oil Market Forecast - January 2022
Summary
The oil market made a great start to the year, with prices hitting their highest levels since 2014 as concerns about Omicron receded. In this month’s Oil Market Forecast we will explore some of the uncertainties around oil supply and lay out our scenarios for US shale activity in the coming year.
A few key points:
- The consensus across agencies is that the impact of Omicron on oil demand will be less than originally feared, with both IEA and EIA raising their demand forecasts.
- Evidence continues to mount over recent months that OPEC+ nations are struggling to reach their production targets. A lack of upstream investment over recent years could result in tightening oil supply later this decade.
- There remains a question mark over how the US shale industry will respond to higher prices, and the capacity of the oilfield services industry to respond to increased activity levels.
- In our view, the oil market looks fairly balanced over the next couple of years.
- Oil prices hit their highest levels since 2014; both Brent and WTI futures curves sit comfortably above their 2021 highs.
- The US land oil rig count reached 471; our best estimate is that it will average 490 for 2022.
Oil Supply and Demand
The consensus of the three main forecasting agencies appears to be that the emergence of the Omicron variant will have much less impact on oil demand than initially feared. The IEA (1) upgraded their 2021 and 2022 demand estimates by 200,000 bbl/day to 96.6 MMbbl/day and 99.9 MMbbl/day in 2021 and 2022 respectively. The EIA (2) added 100,000 bbl/day to its 2022 estimate, bringing in to 100.5 MMbbl/day. OPEC (3), who did not adjust their demand estimates down last month, did not adjust them up this month, holding them flat at 97.7 MMbbl/day and 100.6 MMbbl/day in 2021 and 2022 respectively. Beyond 2022 all three agencies are predicting demand growth, at least through the middle of the next decade. The EIA is predicting an additional 1.75 MMbbl/day of demand in 2023. At nearly 2%, this is above recent historical growth rates, suggesting there will still be some demand catch up next year as air travel moves closer to pre-pandemic norms.
If the demand outlook is steady, the supply outlook is more of a moving target. The prospect of a large-scale return of Iranian crude to market has receded, as the Iran nuclear talks appear deadlocked. Instead, uncertainty stems from concerns over the ability of OPEC+ nations to meet their quotas and the assumption that US production will respond to price signals as it has historically.
To address OPEC+ production capacity first, there were a series of reports towards the end of last year that the OPEC+ group of nations were unable to meet their production targets. The New York Times (4) reported that OPEC+ production fell short of its quota by 650,000 bbl/day in November 2021 and the Wall Street Journal (5) reported a production shortfall of 790,000 bbl/day in December 2021. The New York times reports that, of the large OPEC+ producers, Nigeria, Angola and even Russia are struggling to meet their quotas, with the IHS quoted as saying that Russia has hit a production wall at 9.9 MMbbl/day and will require tax changes or new investment to raise production beyond that level. Russian capacity is one of the most contentious areas in this debate, as last year’s production data tends to bear out the struggle that Nigeria and Angola have had but suggests that Russia is ready to return to pre-pandemic capacity. Indeed, Platts (6) reported that Russia is prepared to return to pre-pandemic production in May this year and both the IEA and EIA are forecasting Russian production in the 11.5 MMbbl/day – 12 MMbbl/day range for 2022.
What would cause this difficulty to return oil production to market and are these concerns credible? The following chart is taken from the IEA’s Oil 2021 report (7), and shows historical upstream CAPEX spend since its peak, in 2014.
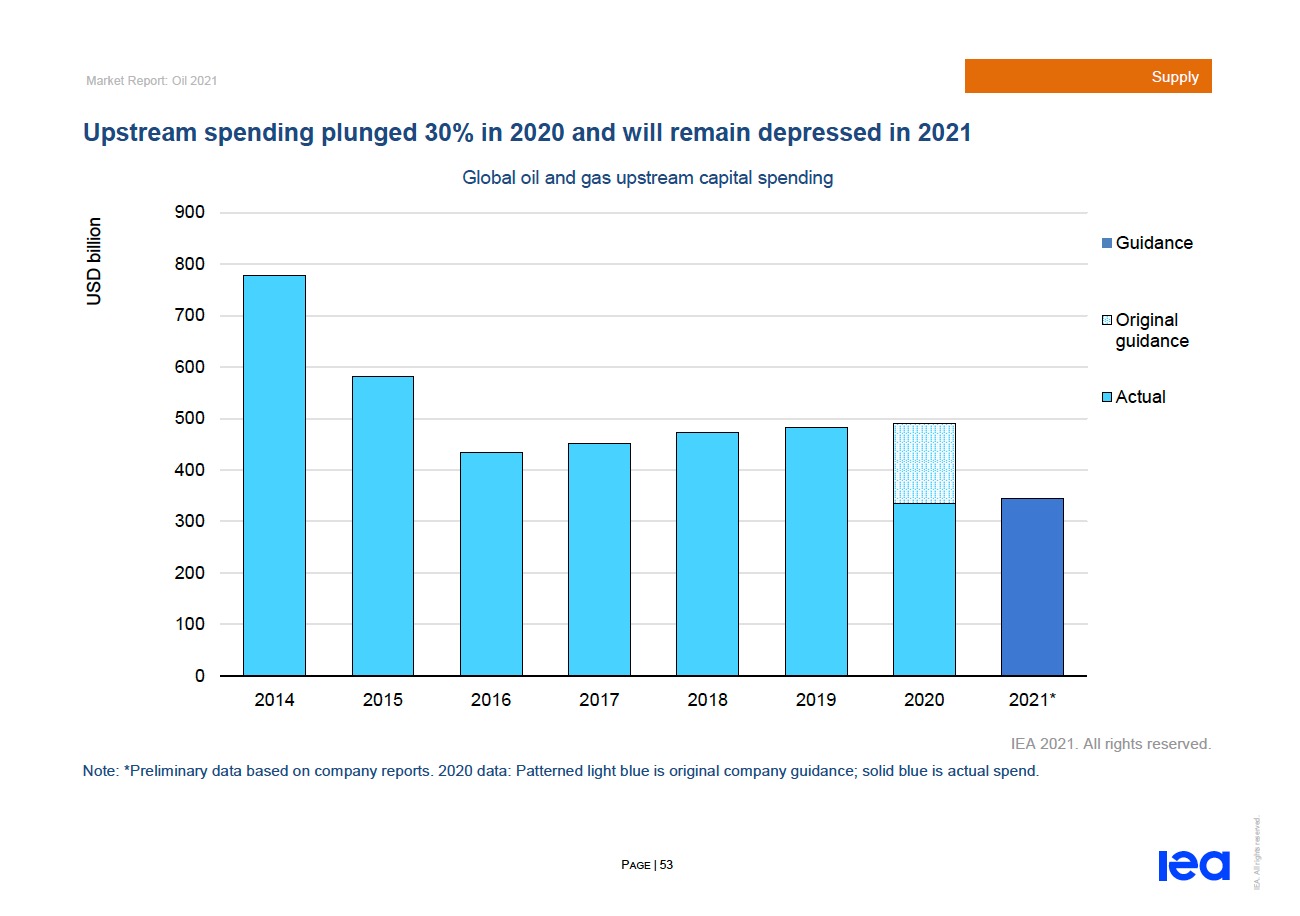
Figure 1 - Historical Upstream CAPEX Spend
Figure 1 shows upstream investment running at just over 50% of historic levels since 2016, and at just under 50% over the last couple of years. In 2014, supply growth was outstripping demand growth, so perhaps this is the appropriate level of expenditure in a ~ 1% demand growth world. It is hard to know, because of the nature of the industry and cycle times. How long does it take to find and develop a conventional hub class oil field, going from acreage acquisition to first oil? It depends, but eight years would be an optimistic assessment. Of those eight years, three to four years would be spent in execution, when contracts are let, and CAPEX committed; so, past the point of not return. There is more flexibility to exit or defer development of fields that are earlier in the lifecycle – exploration, appraisal, concept selection or even FEED. This means that supply will start to lag four our more years after investment levels are cut, and it will accelerate for some time as there will be a lack of fields in the earlier stages of maturation to bring forward for execution. A recent report from Rystad (8), where they calculate oil & gas discoveries in 2021 will be at their lowest level in 75 years, tends to bear this out. It certainly looks possible that the next few years could see tightening supplies because of years of underinvestment. This is no means certain, however. The IEA, in the same Oil 2021 report, predict that OPEC+ spare capacity will be higher through the first half of the 2020’s than it was through the second half of the 2010’s.
If there is a concern over the ability of conventional international supply to meet rising demand, what about the response of US shale? Here the consensus among the IEA, EIA and OPEC is that 2022 will see a surge in US activity and record US production. We are not so sure that that is the case. Historically, if you look at the way US investment has responded to price, then we should see a huge ramp up in rig and completion spread counts and a consequent surge in US production. This time, however, it might be different.
The last couple of years has seen a change in the contract between investor and operator. Instead of growth, the focus has shifted to returns - keep production flat, activity levels steady, pay down debt and return the rest to investors. Consequently, the US shale industry is less likely to respond to price signals than in prior years.
What would happen if that discipline broke down? In their November Drilldown podcast (9), Richard and John Spears of Spears and Associates, described an oilfield services industry operating at full capacity. Their view is that all available equipment is currently under contract, and so to expand capacity further would require capital investment, something the oilfield services industry will be reluctant to undertake speculatively. These firms would require multi-year contracts, guaranteeing a return on that capital investment, something that the smaller operating companies that have made up most incremental activity would be unable to underwrite. This creates a dynamic where CAPEX increases will be restrained in one way or another; the operators will be restrained by their investors, and if that restraint fails then by the capacity of the oilfield services industry to execute the work.
Where does this leave us? Our view is that OPEC+ production will continue rise throughout the year but will continue to lag target production levels. In terms of US production, we are more bullish in our December forecast; we expect the US to add ~ 400,000 barrels/day by year end, but don’t see the US setting new production records in the next couple of years. This gives a supply and demand balance, as shown in Figure 2, that runs a slight deficit through 2022 and 2023.
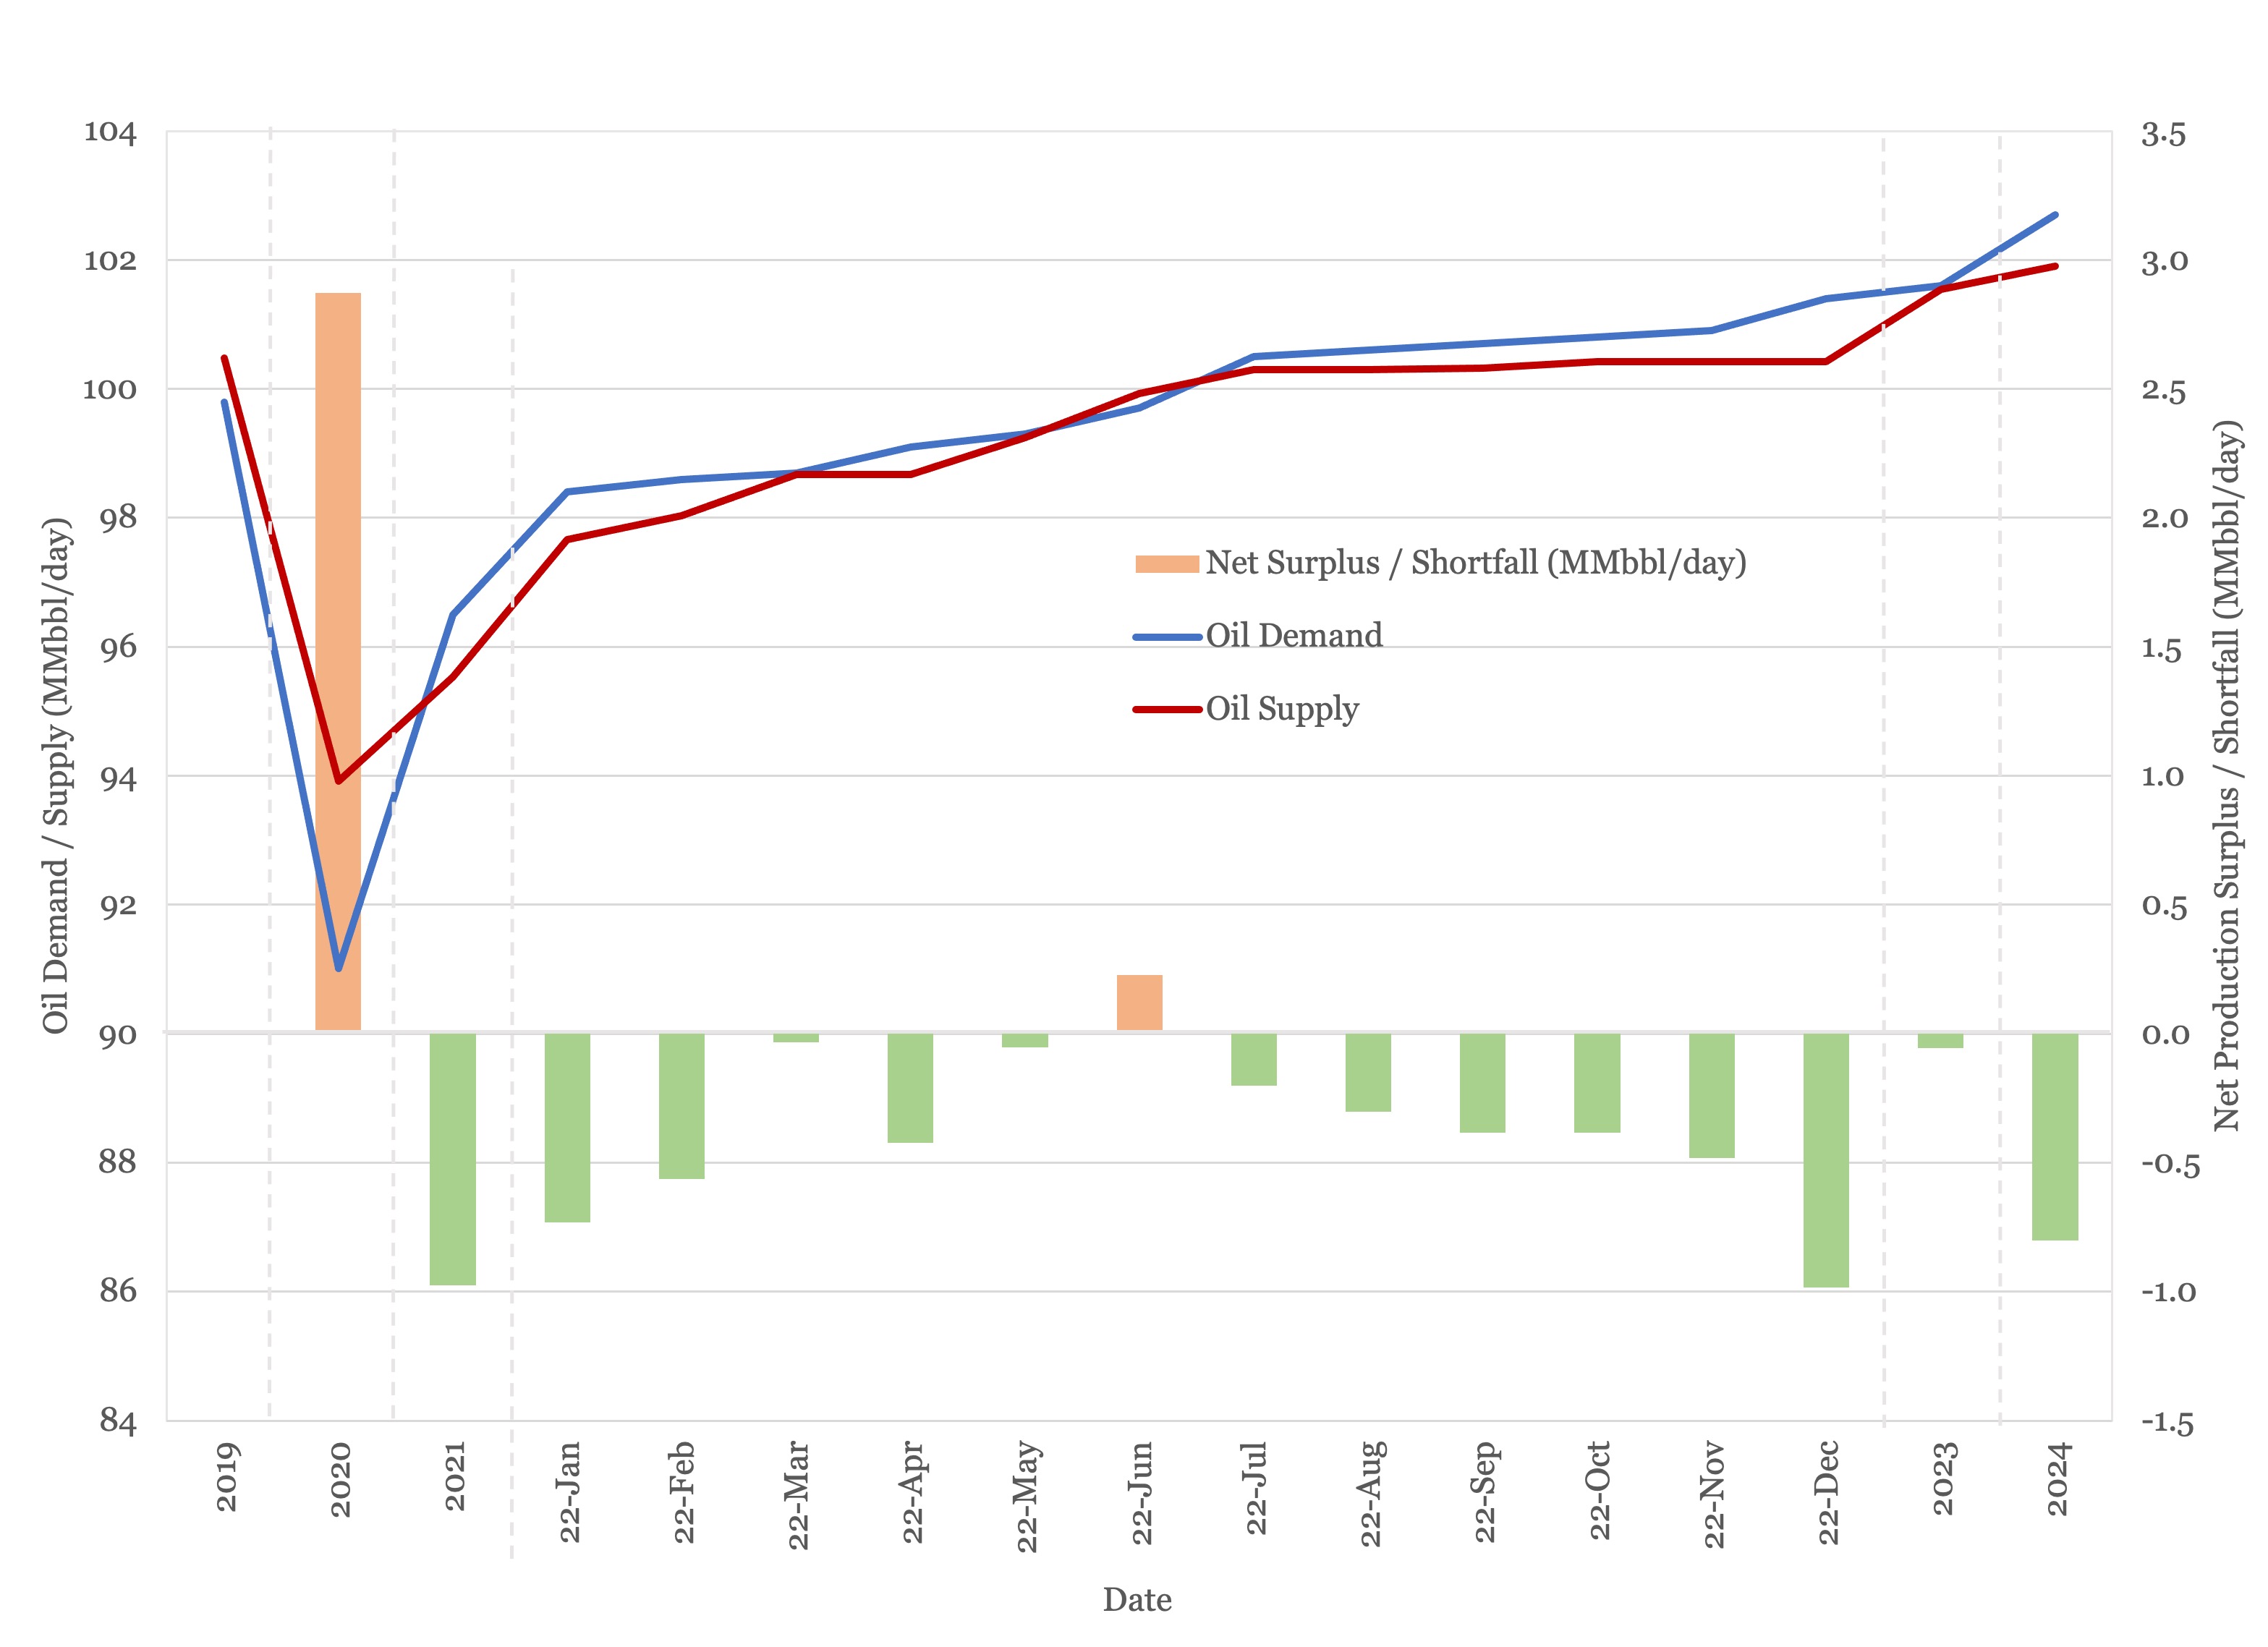
Figure 2 - Supply and Demand Surplus Forecast
Either stronger production growth by OPEC+, or higher US shale activity would be enough to flip this balance to a surplus over the next couple of years, which would be in line with the IEA forecast. Conversely any supply shock, a terrorist attack in the Middle East, or a drop in Russian supply in retaliation to sanctions, would be enough to push the balance to a sharp deficit.
Oil Storage
We estimate global oil inventory drawdowns of 356 MMbbl in 2021, following a build of 1,027 MMbbl in 2020. With this month’s higher estimates for 2022 demand and a growing OPEC+ production shortfall, we expect a drawdown of 131 MMbbl for 2022. Figure 3 shows global storage capacity and inventories. If supply and demand follow the current forecast, global inventories should sit around the five-year average for 2022 to 2023.

Figure 3 - Global Storage Chart
Oil Prices
Oil prices surged this month as concerns about the impact of Omicron receded with both Brent and WTI touch their highest levels since 2014, at just over and just under $88/bbl respectively. The EIA and Standard Chartered (10) raised their estimates for Brent to $75 for the year, the Economist (11) estimated $79/bbl, and Goldman Sachs (12) came in on top at $96/bbl.
Both Brent and WTI futures rose; at the time of writing both are above their 2021 highs. Brent is above $70/bbl out to 2025, with WTI above $60/bbl for the next decade.

Figure 4 - Brent Crude Oil Futures
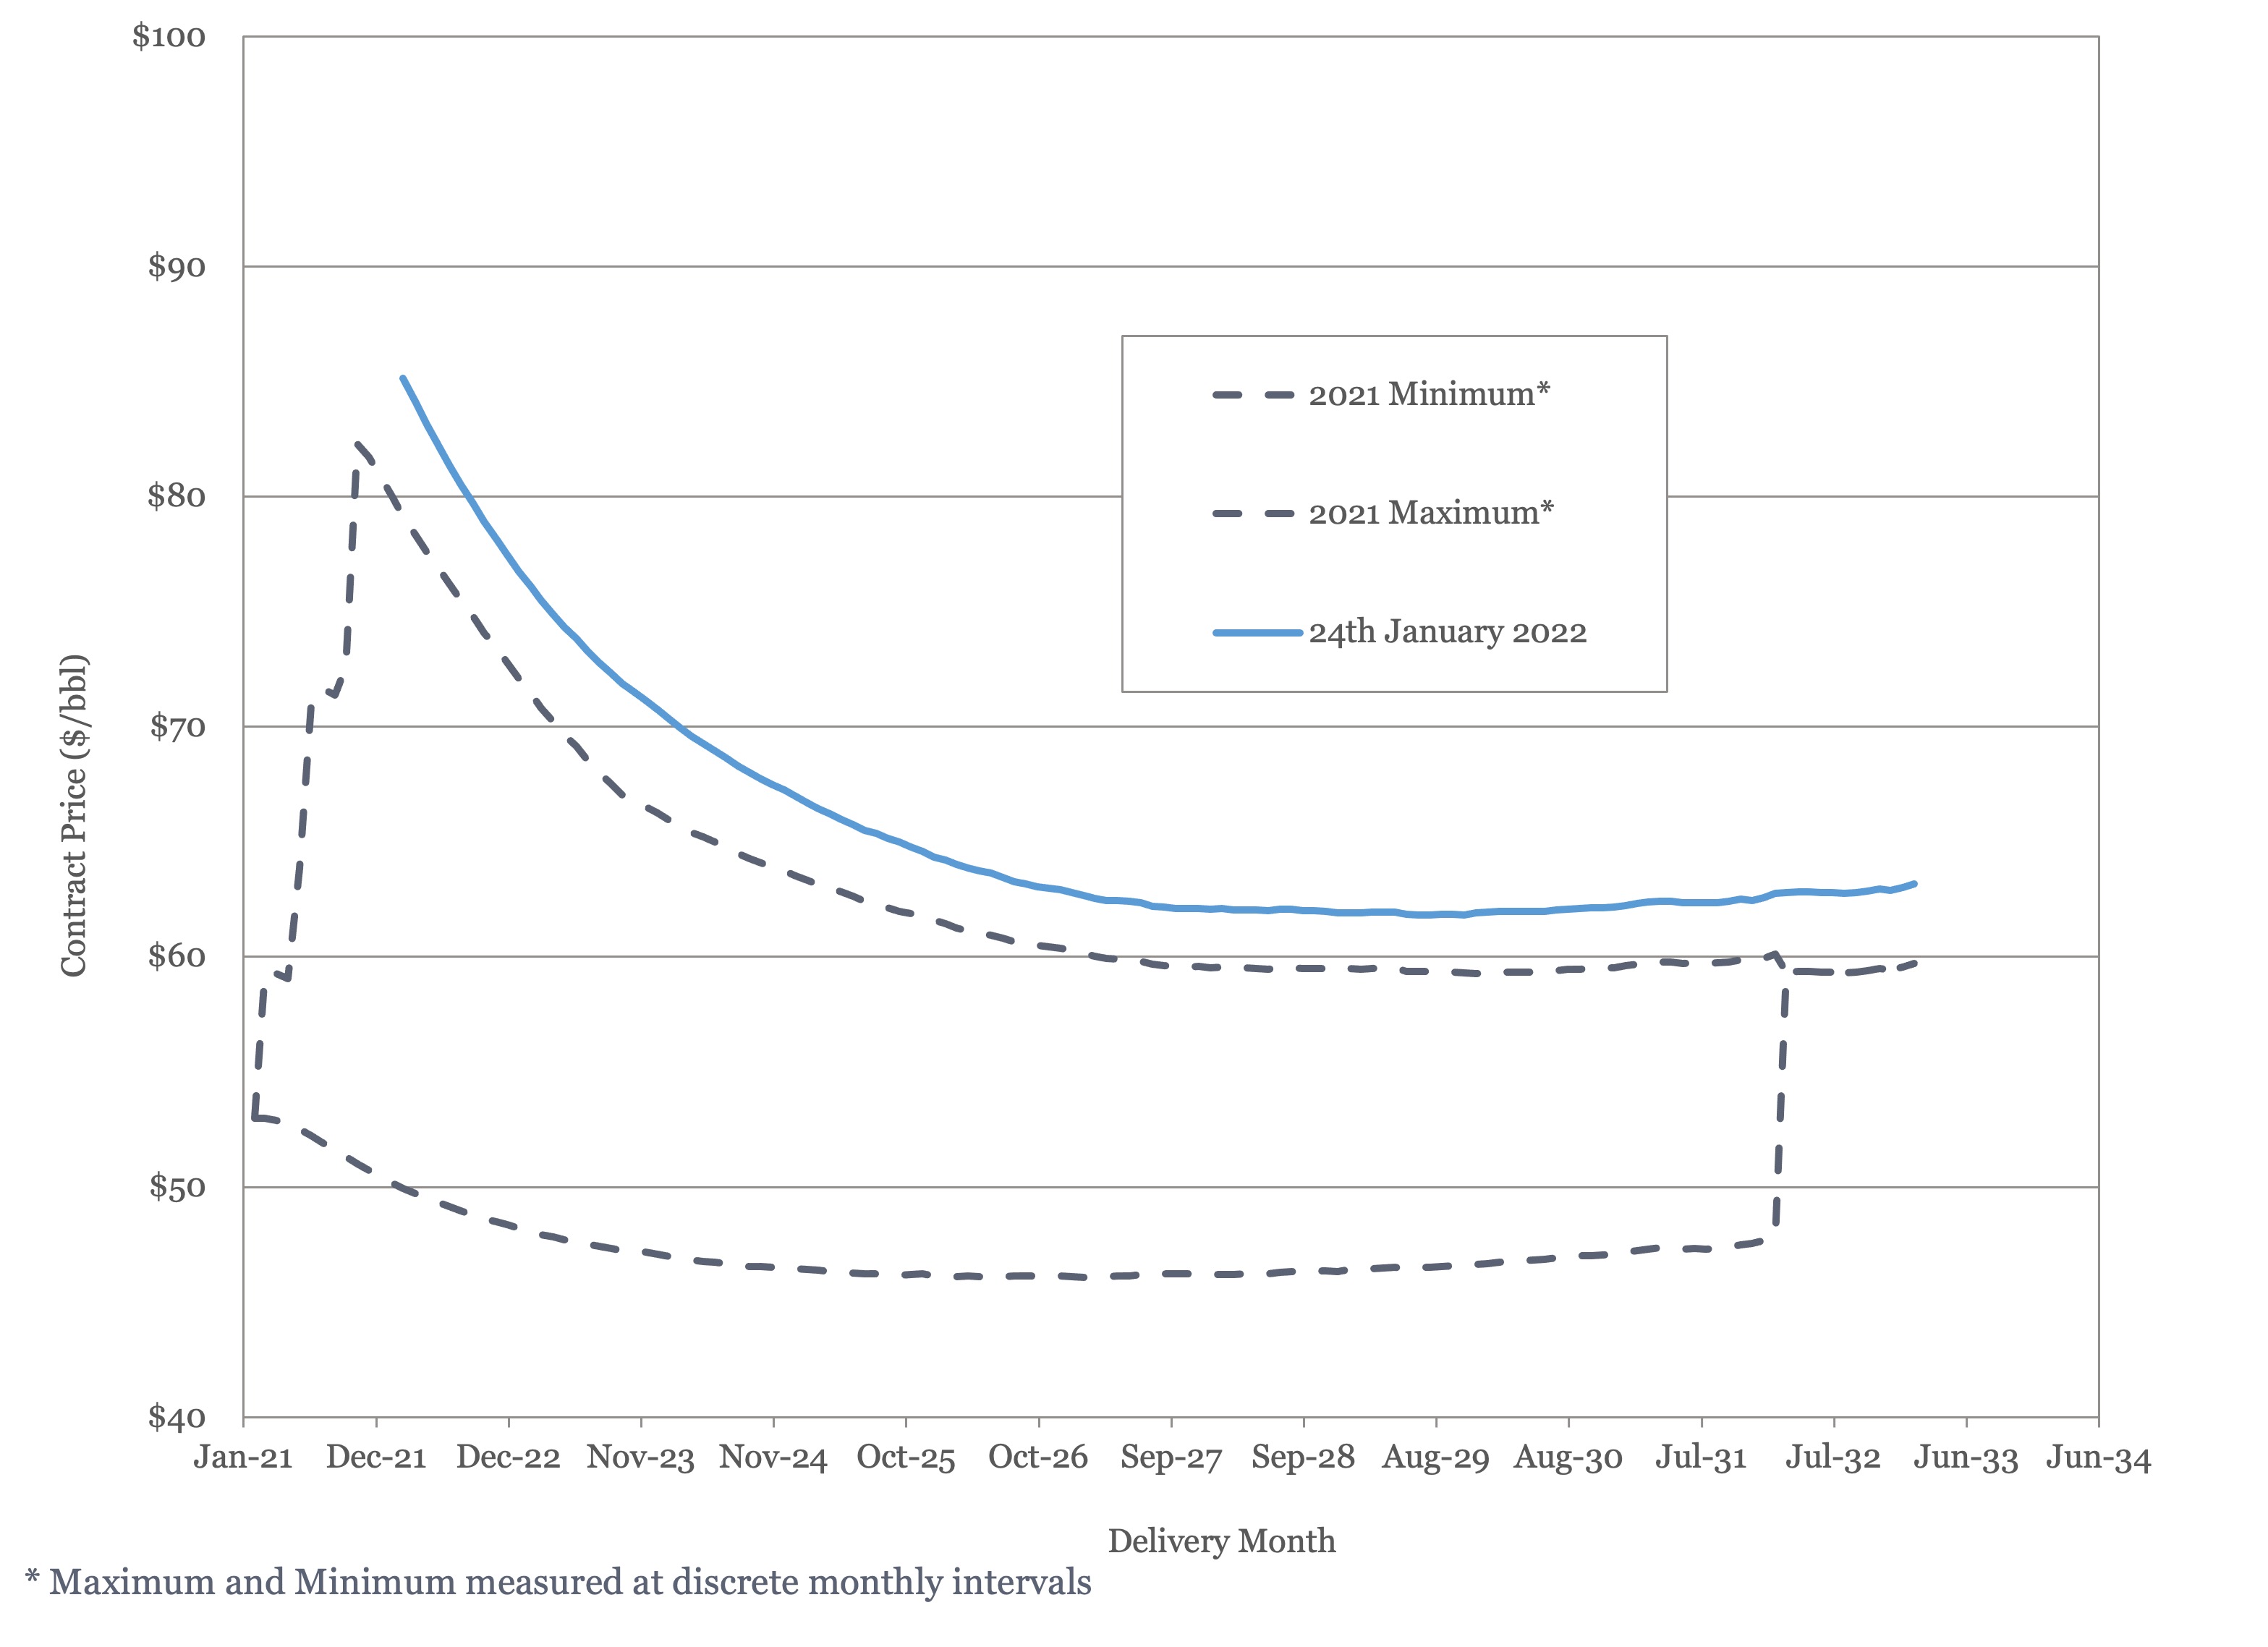
Figure 5 - WTI Crude Oil Futures
With the oil market roughly in balance and demand recovering slowly, it appears that these price increases are being driven by heightened geopolitical concerns in the Middle East and Europe.
US Activity
The US land oil rig count stood at 471 on the 21st of January, down by one from the week before. Our best estimate of average land oil rig count for the year is 490, which would be consistent with a 35% increase in activity level over 2021 and implies a small increase in rig count over the year and consistent with ~ 400,00 bbl/day of additional US production. Our low case is based on a 20% activity level increase over 2021, which would see an average land oil rig count of 435 for the year, implying a fall in rig counts as the year progresses. Our high case, which is consistent with the activity levels that we think would be required to boost US production to levels that the IEA, EIA, and OPEC forecast, would see an average land oil rig count for the year of 585; suggesting that rig counts would return to close to 700 by year end.

Figure 6 - US Land Oil Rig Count
(1) Oil Market Report – January 2022, IEA, Paris.
(2) Short Term Energy Outlook (STEO), January 6th, 2022, U.S. Energy Information Administration.
(3) “OPEC Monthly Oil Market Report”, Organization of the Petroleum Exporting Countries, January 18th, 2022.
(4) “OPEC and Russia agree to increase oil output amid lagging production.”, Stanley Reed, New York Times, January 4th, 2022.
(5) “Oil Demand to Exceed Pre-Covid Levels in 2022, IEA Says”, Will Horner, Wall Street Journal, January 19th, 2022.
(6) “Russia's 2021 oil output up 2.4% on year on increased OPEC+ quotas”, Rosemary Griffin, S&P Global Platts, January 2nd, 2022.
(7) “Oil 2021”, IEA, 2021, Paris
(8) “Global oil and gas investments to hit $628 billion in 2022, led by upstream gas and LNG”, January 11th, 2022, Rystad Energy
(9) “EP214: Point-Counterpoint: Part 2”, The Drilldown: In Depth Answers to Oilfield Questions, November 16th, 2021, Spears and Associates
(10) “Standard Chartered Sees $100+ Oil”, Andreas Exarheas, Rigzone, January 13th, 2022.
(11) “The World Ahead 2022”, The Economist
(12) “Goldman Sachs Sees $105 Oil in 2023”, Tsvetana Paraskova, OilPrice.com, January 18th, 2022.


Explore Our Services
Business Development
Oil & Gas an extractive industry, participants must continuously find and develop new oil & gas fields as existing fields decline, making business development a continuous process.

Strategy
We approach strategy through a scenario driven assessment of the client’s current portfolio, organizational competencies, and financial framework. The strategy defines portfolio actions and coveted asset attributes.
Origination
Deal origination consists of identifying coveted assets, assets with attributes consistent with the client’s strategy, and qualified buyers. We advocate a proactive approach to business development and will undertake outreach on our client’s behalf.
Transaction Support
Transaction support consists of in depth asset evaluation, negotiation of commercial agreements or preparation of license round submission and close out of conditions. We can also aid in joint venture set up and management and asset maturation as required.