Oil Market Forecast - June 2022
Summary
While demand estimates for the year seem to have stabilized, there was some surprising news from the IEA on their demand growth outlook for next year. There has also been some conflicting coverage on oil supply over the last month, so in this month’s Oil Market Forecast we will spend some digging into what is happening on the supply side together with the regular update on oil stocks, prices, and US activity.
A few key points:
- The IEA, EIA and OPEC all held their 2022 oil demand estimates steady.
- The IEA predicted 2.2% growth in oil demand in 2023, putting demand growth well ahead of their most aggressive Stated Policies demand forecast.
- Russian oil exports rose last month; it now appears sanctions are likely to have a more limited impact on Russian production.
- OPEC+ raised their July production target by 632,000 bbl/day, but actual OPEC production fell in May.
- A significant upward revision in 2021 demand meant that oil stocks fell below their five-year average in 2021.
- Spot prices are sitting around the same level they were last month, but futures prices are up.
- The US land oil rig count continued to grow, hitting 563 on June 10th.
Oil Supply and Demand
The IEA (1), EIA (2), and OPEC (3), all held their 2022 oil demand estimates steady at 99.4 MMbbl/day, 99.6 MMbbl/day, and 100.3 MMbbl/day respectively this month. The IEA published a 2023 demand estimate of 101.6 MMbbl/day, which would constitute a 2.2% increase over projected 2022 demand. This is significantly faster than the 1.2% average since the beginning of the 21st century, and a long way ahead of their Stated Policies demand growth forecast which is closer to 0.5% per annum. There is probably still some element of COVID-19 catch up in these growth numbers, but it is worth noting that under the IEA Stated Policies long term forecast, which is their highest oil demand projection, this level of demand was not predicted until 2026/2027. The EIA carries similar demand estimates for 2023, having cut their estimate to 101.3 MMbbl/day in the latest edition of their short-term energy outlook, from 101.5 MMbbl/day the prior month.
The news on the supply side has been a lot less consistent. Over the course of the last month there have been varying estimates of supply from Russia, now and in the future, together with both mixed signals and mixed delivery from OPEC. The US supply response to a sustained period of high oil prices is also unclear.
To start with Russia, the IEA’s original estimate was that formal and informal sanctions would reduce Russian crude oil supplies by 3 MMbbl/day in July. The latest view is that May actually saw a recovery in Russian oil exports, rising by about 130,000 bbl/day to 10.55 MMbbl/day (4). This puts Russian output down by 850,000 bbl/day over pre-invasion levels. All indications are that Russia is successfully finding alternative buyers for its heavily discounted crude, and there is no reason to believe that any sort of natural limit to this export re-orientation has been reached.
The EU did agree to a package of sanctions, including a ban on Russian oil imports, that will come into effect at the end of the year (5). The ban covers seaborne oil and oil products, which constitute about two thirds of Russian oil exports to the EU. Pipeline deliveries were exempt from the ban, although Germany and Poland have volunteered to stop importing Russian crude by the end of the year. The IEA expects this to result in a 3 MMbbl/day fall in Russian oil production by the beginning of 2023, something which would leave the market severely undersupplied and result in prices rising far beyond the elevated levels that we see today. Indeed, there are already discussions between the US, UK, and the EU on how to blunt the impact of EU sanctions, particularly the ban on insuring shipments of Russian oil (6). Our view is that a solution will be found, and we expect Russian oil production to recover slowly as they continue to push into new markets. Our supply and demand model has been updated this month to reflect that.
The second item of note on the supply side concerns OPEC+. Participants at the 29th OPEC and non-OPEC Ministerial Meeting on the June 2nd, agreed to accelerate their production increases to 648,000 bbl/day in July. At the same time, OPEC, which excludes Russia and several other nations, actually saw production fall by 176,000 bbl/day in May. This adds to the growing sense that OPEC does not have the capacity to achieve the production increases that it is targeting on a monthly basis. This is risk that the IEA thinks will grow in 2023 as demand jumps.
As we reach the halfway point in the year, US land oil rig counts continue to rise. They are tracking our most aggressive rig count forecast for the year. There is still some diversity in opinion on US production growth, but we have now increased our forecast from 600,000 bbl/day to 1.1 MMbbl/day, which means we expect US production to average of 17.8 MMbbl/day this year.
The net effect is that the oil market remains in a deficit until the fourth quarter of this year, before flipping back to deficit in 2023 and 2024, as shown in Figure 1.

Figure 1 - Supply and Demand Surplus Forecast
Oil Storage
This month’s oil storage chart incorporates a significant 2021 upward demand revision. With this revision included, 2021 stocks fell by 728 MMbbl, rather than the 321 MMbbl reported in last month’s forecast. This was enough to push storage below the five-year average in 2021, and we expect it continue to decline throughout the year, reaching 2019 levels by year end.

Figure 2 - Global Storage Chart
Oil Prices
At the time of writing, WTI is sitting at about $110/barrel, around where it was this time last month following a rise into the $120s in early June. Both Brent and WTI futures were up this month, through most of the contract period.

Figure 3 - Brent Crude Oil Futures
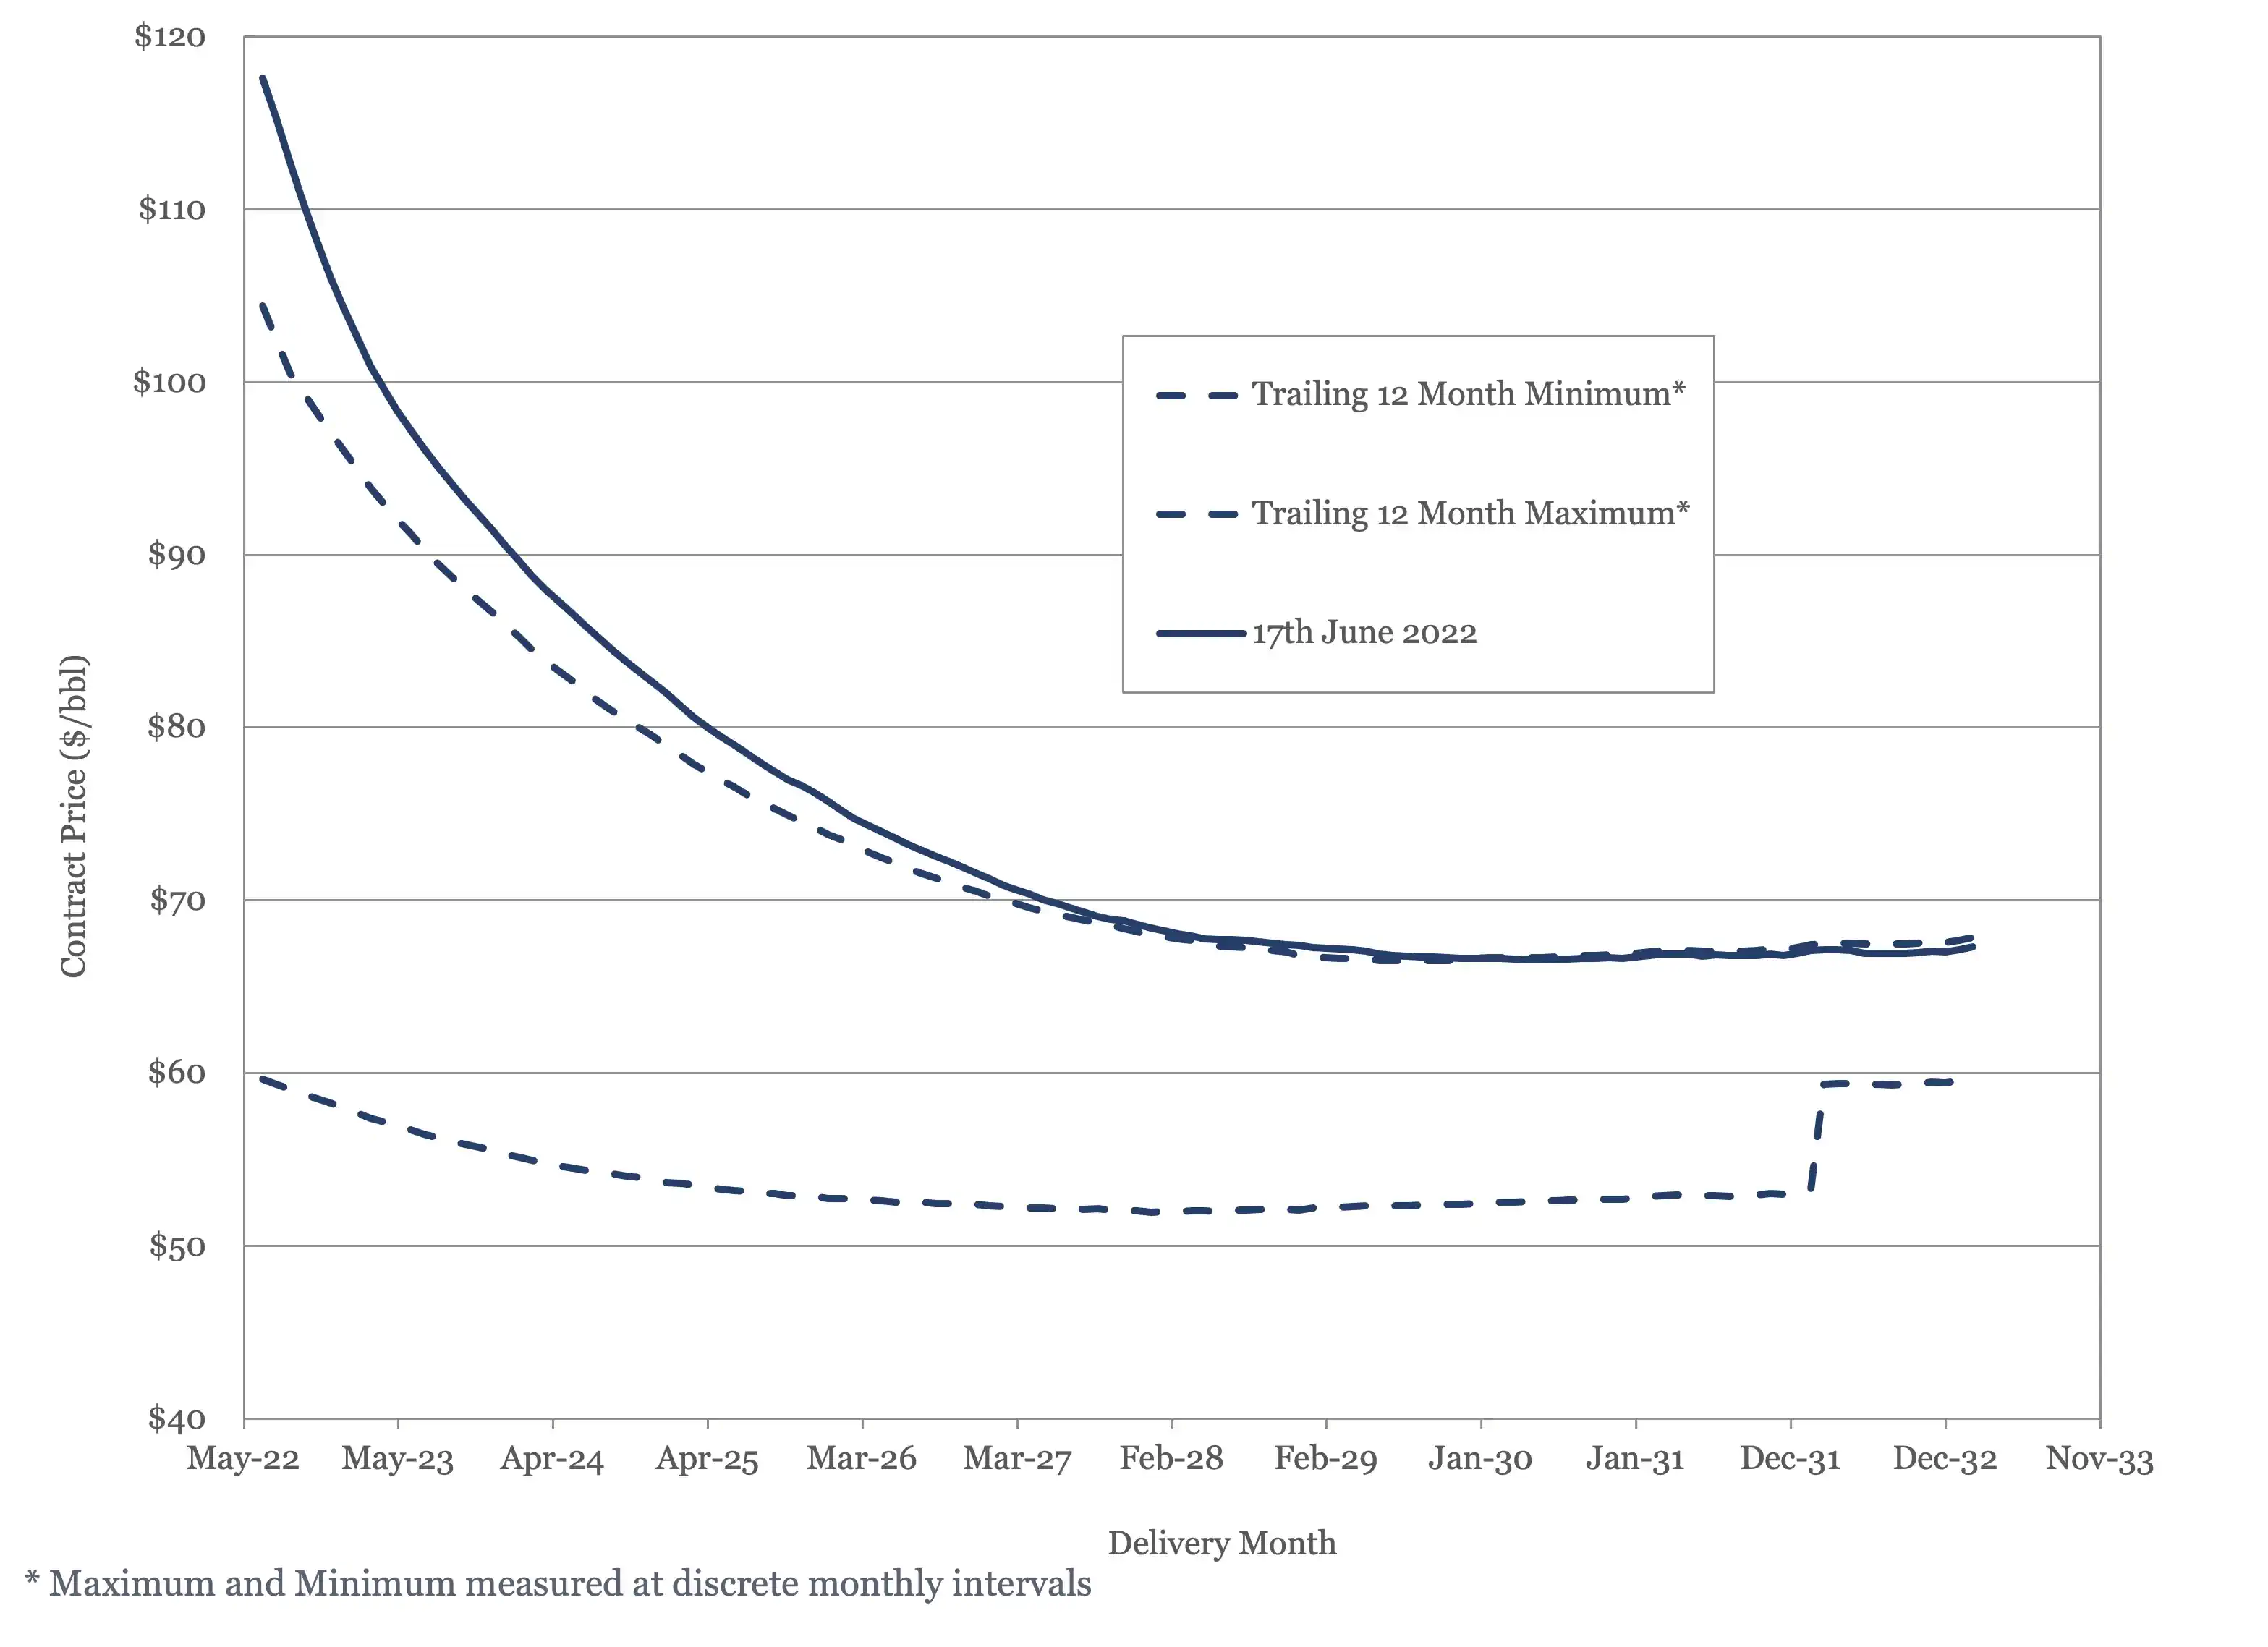
Figure 4 - WTI Crude Oil Futures
US Activity
The US land oil rig count continues to rise, hitting 563 on the 10th of June. It is currently tracking slightly above our most aggressive forecast, see Figure 5.
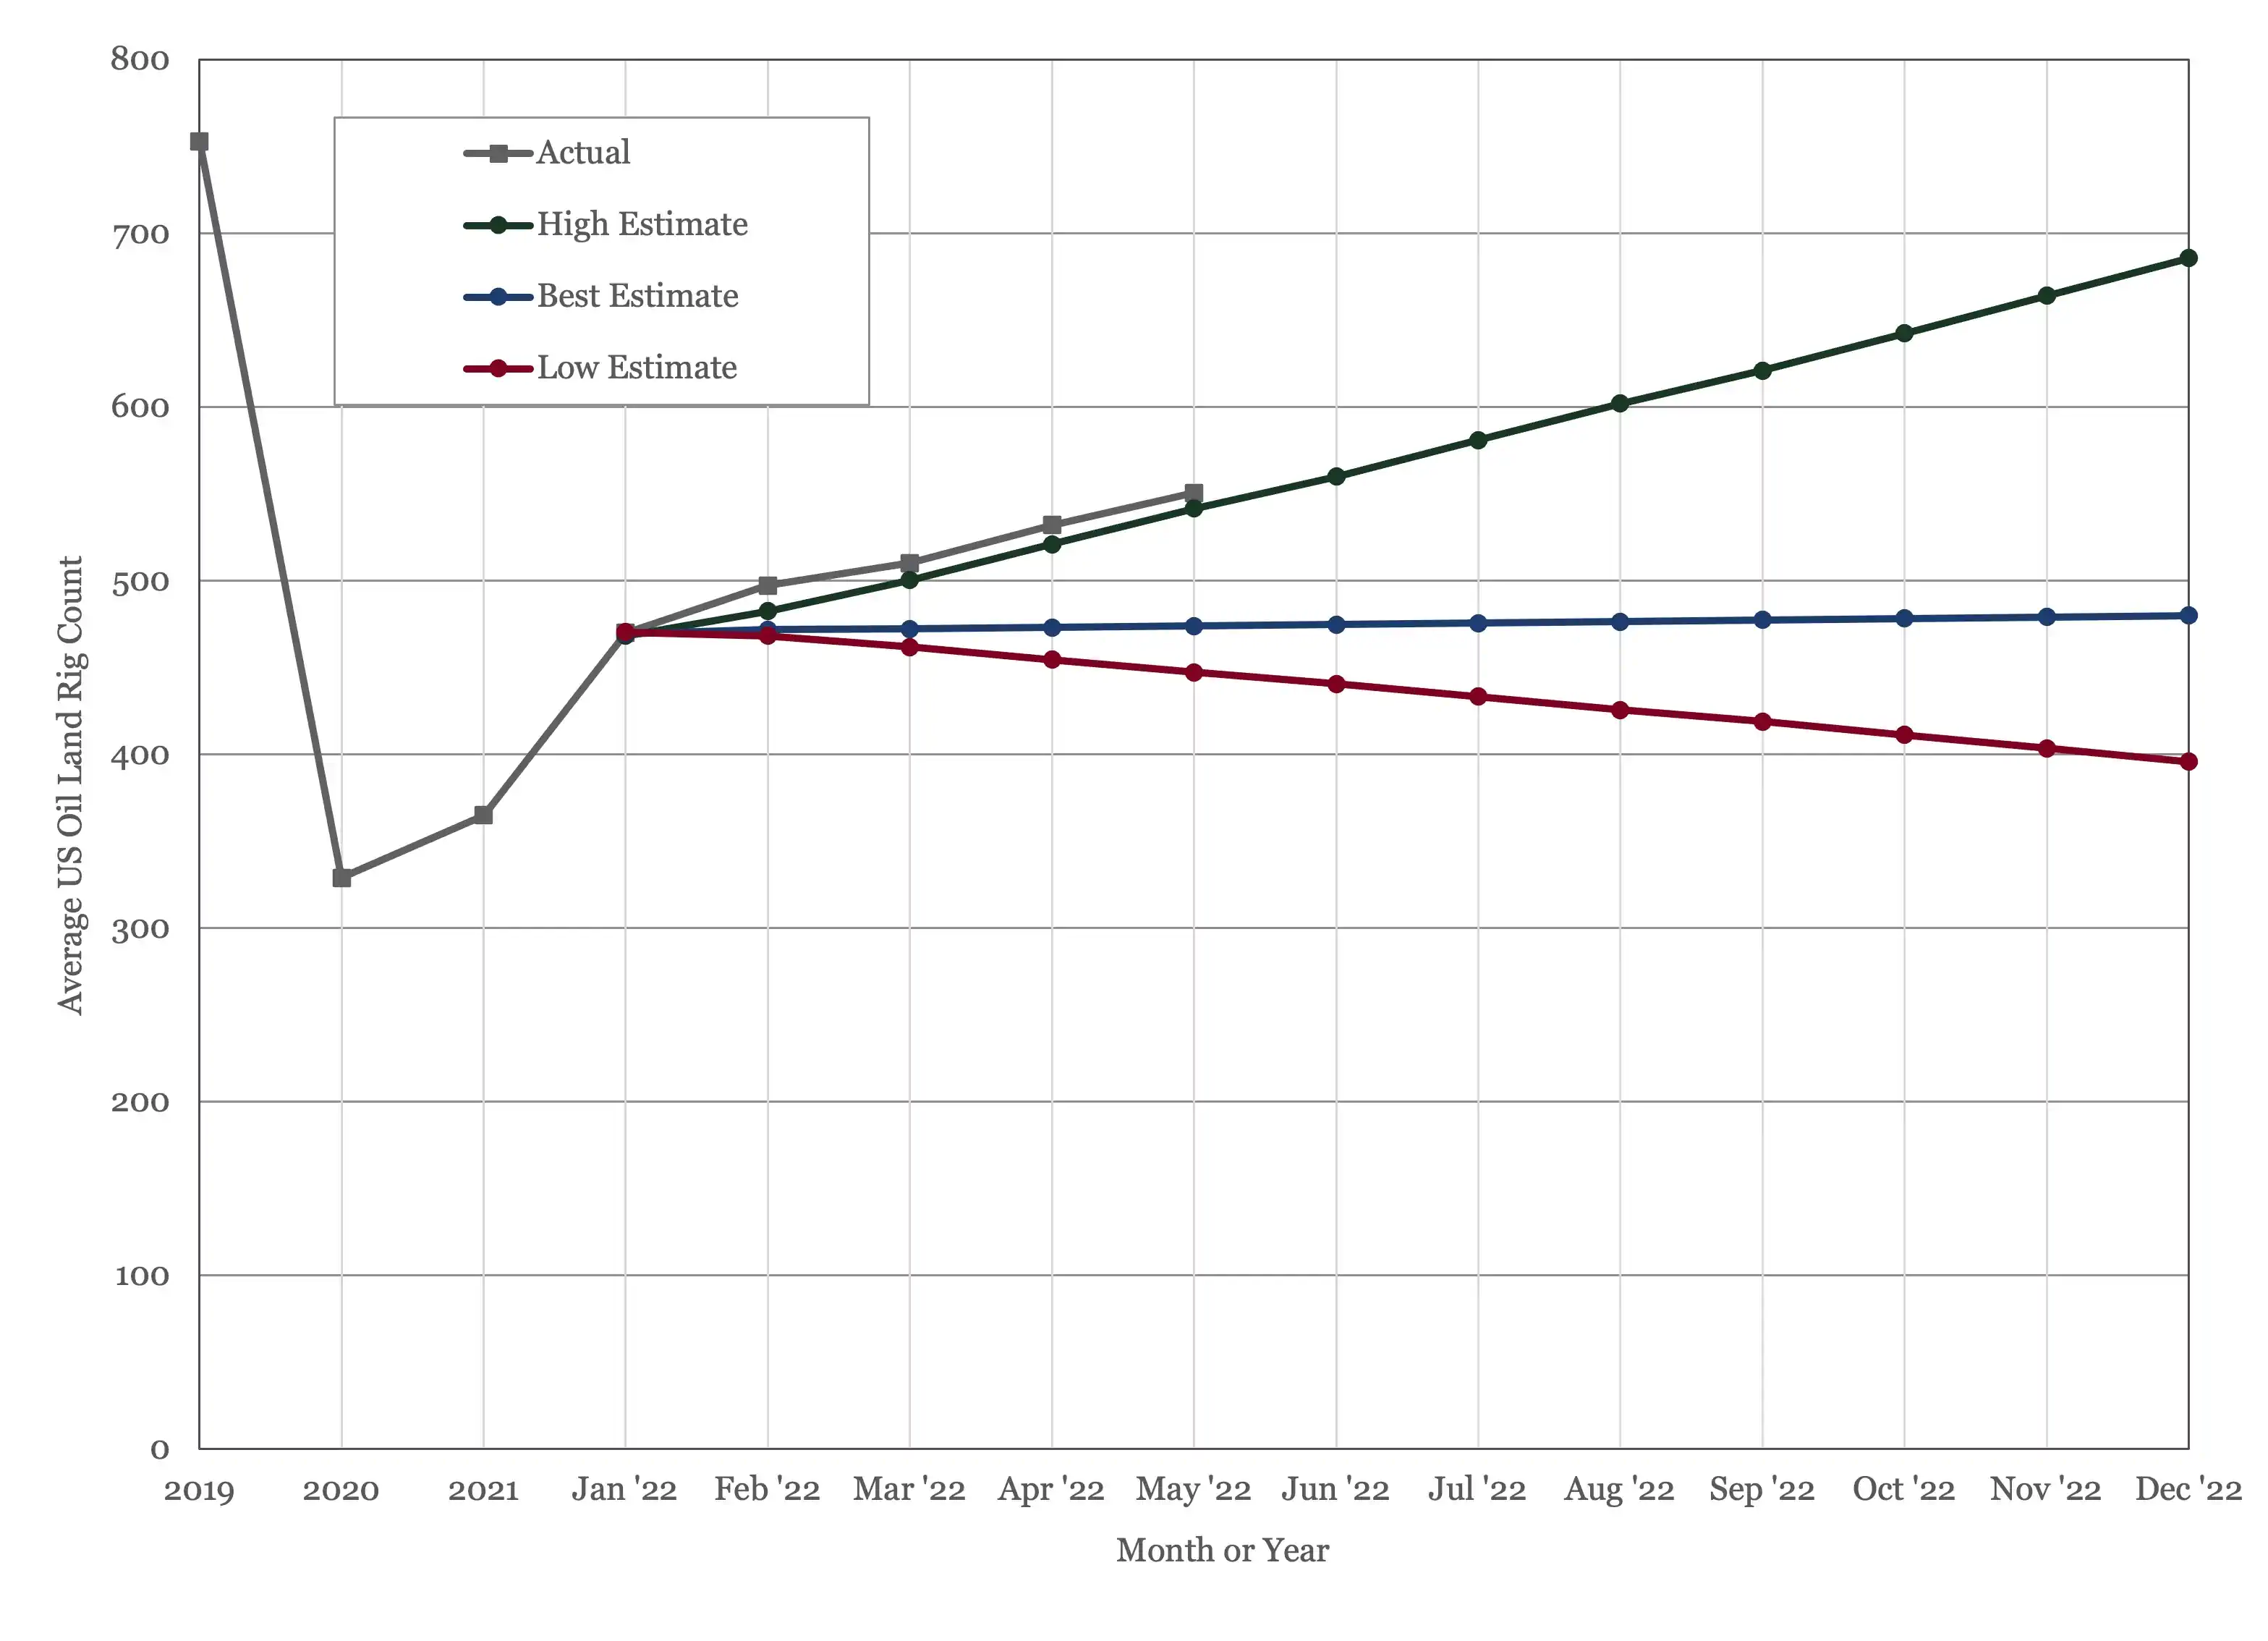
Figure 5 - US Land Oil Rig Count
(1) Oil Market Report – June 15th, 2022, IEA, Paris.
(2) Short Term Energy Outlook (STEO), June 7th, 2022, U.S. Energy Information Administration.
(3) “OPEC Monthly Oil Market Report”, Organization of the Petroleum Exporting Countries, June 14th, 2022.
(4) “Russia’s oil output rose last month, despite sanctions”, Stanley Reed, The New York Times, June 15th, 2022.
(5) “EU leaders agree to ban majority of Russian oil imports”, Sam Fleming, Valentina Pop and Andy Bounds, Financial Times, May 30th, 2022.
(6) “U.S., European Allies Try to Retrain Global Oil Prices”, Andrew Duehren, The Wall Street Journal, June 9th, 2022.


Oil Market Forecast - June 2022
Summary
While demand estimates for the year seem to have stabilized, there was some surprising news from the IEA on their demand growth outlook for next year. There has also been some conflicting coverage on oil supply over the last month, so in this month’s Oil Market Forecast we will spend some digging into what is happening on the supply side together with the regular update on oil stocks, prices, and US activity.
A few key points:
- The IEA, EIA and OPEC all held their 2022 oil demand estimates steady.
- The IEA predicted 2.2% growth in oil demand in 2023, putting demand growth well ahead of their most aggressive Stated Policies demand forecast.
- Russian oil exports rose last month; it now appears sanctions are likely to have a more limited impact on Russian production.
- OPEC+ raised their July production target by 632,000 bbl/day, but actual OPEC production fell in May.
- A significant upward revision in 2021 demand meant that oil stocks fell below their five-year average in 2021.
- Spot prices are sitting around the same level they were last month, but futures prices are up.
- The US land oil rig count continued to grow, hitting 563 on June 10th.
Oil Supply and Demand
The IEA (1), EIA (2), and OPEC (3), all held their 2022 oil demand estimates steady at 99.4 MMbbl/day, 99.6 MMbbl/day, and 100.3 MMbbl/day respectively this month. The IEA published a 2023 demand estimate of 101.6 MMbbl/day, which would constitute a 2.2% increase over projected 2022 demand. This is significantly faster than the 1.2% average since the beginning of the 21st century, and a long way ahead of their Stated Policies demand growth forecast which is closer to 0.5% per annum. There is probably still some element of COVID-19 catch up in these growth numbers, but it is worth noting that under the IEA Stated Policies long term forecast, which is their highest oil demand projection, this level of demand was not predicted until 2026/2027. The EIA carries similar demand estimates for 2023, having cut their estimate to 101.3 MMbbl/day in the latest edition of their short-term energy outlook, from 101.5 MMbbl/day the prior month.
The news on the supply side has been a lot less consistent. Over the course of the last month there have been varying estimates of supply from Russia, now and in the future, together with both mixed signals and mixed delivery from OPEC. The US supply response to a sustained period of high oil prices is also unclear.
To start with Russia, the IEA’s original estimate was that formal and informal sanctions would reduce Russian crude oil supplies by 3 MMbbl/day in July. The latest view is that May actually saw a recovery in Russian oil exports, rising by about 130,000 bbl/day to 10.55 MMbbl/day (4). This puts Russian output down by 850,000 bbl/day over pre-invasion levels. All indications are that Russia is successfully finding alternative buyers for its heavily discounted crude, and there is no reason to believe that any sort of natural limit to this export re-orientation has been reached.
The EU did agree to a package of sanctions, including a ban on Russian oil imports, that will come into effect at the end of the year (5). The ban covers seaborne oil and oil products, which constitute about two thirds of Russian oil exports to the EU. Pipeline deliveries were exempt from the ban, although Germany and Poland have volunteered to stop importing Russian crude by the end of the year. The IEA expects this to result in a 3 MMbbl/day fall in Russian oil production by the beginning of 2023, something which would leave the market severely undersupplied and result in prices rising far beyond the elevated levels that we see today. Indeed, there are already discussions between the US, UK, and the EU on how to blunt the impact of EU sanctions, particularly the ban on insuring shipments of Russian oil (6). Our view is that a solution will be found, and we expect Russian oil production to recover slowly as they continue to push into new markets. Our supply and demand model has been updated this month to reflect that.
The second item of note on the supply side concerns OPEC+. Participants at the 29th OPEC and non-OPEC Ministerial Meeting on the June 2nd, agreed to accelerate their production increases to 648,000 bbl/day in July. At the same time, OPEC, which excludes Russia and several other nations, actually saw production fall by 176,000 bbl/day in May. This adds to the growing sense that OPEC does not have the capacity to achieve the production increases that it is targeting on a monthly basis. This is risk that the IEA thinks will grow in 2023 as demand jumps.
As we reach the halfway point in the year, US land oil rig counts continue to rise. They are tracking our most aggressive rig count forecast for the year. There is still some diversity in opinion on US production growth, but we have now increased our forecast from 600,000 bbl/day to 1.1 MMbbl/day, which means we expect US production to average of 17.8 MMbbl/day this year.
The net effect is that the oil market remains in a deficit until the fourth quarter of this year, before flipping back to deficit in 2023 and 2024, as shown in Figure 1.
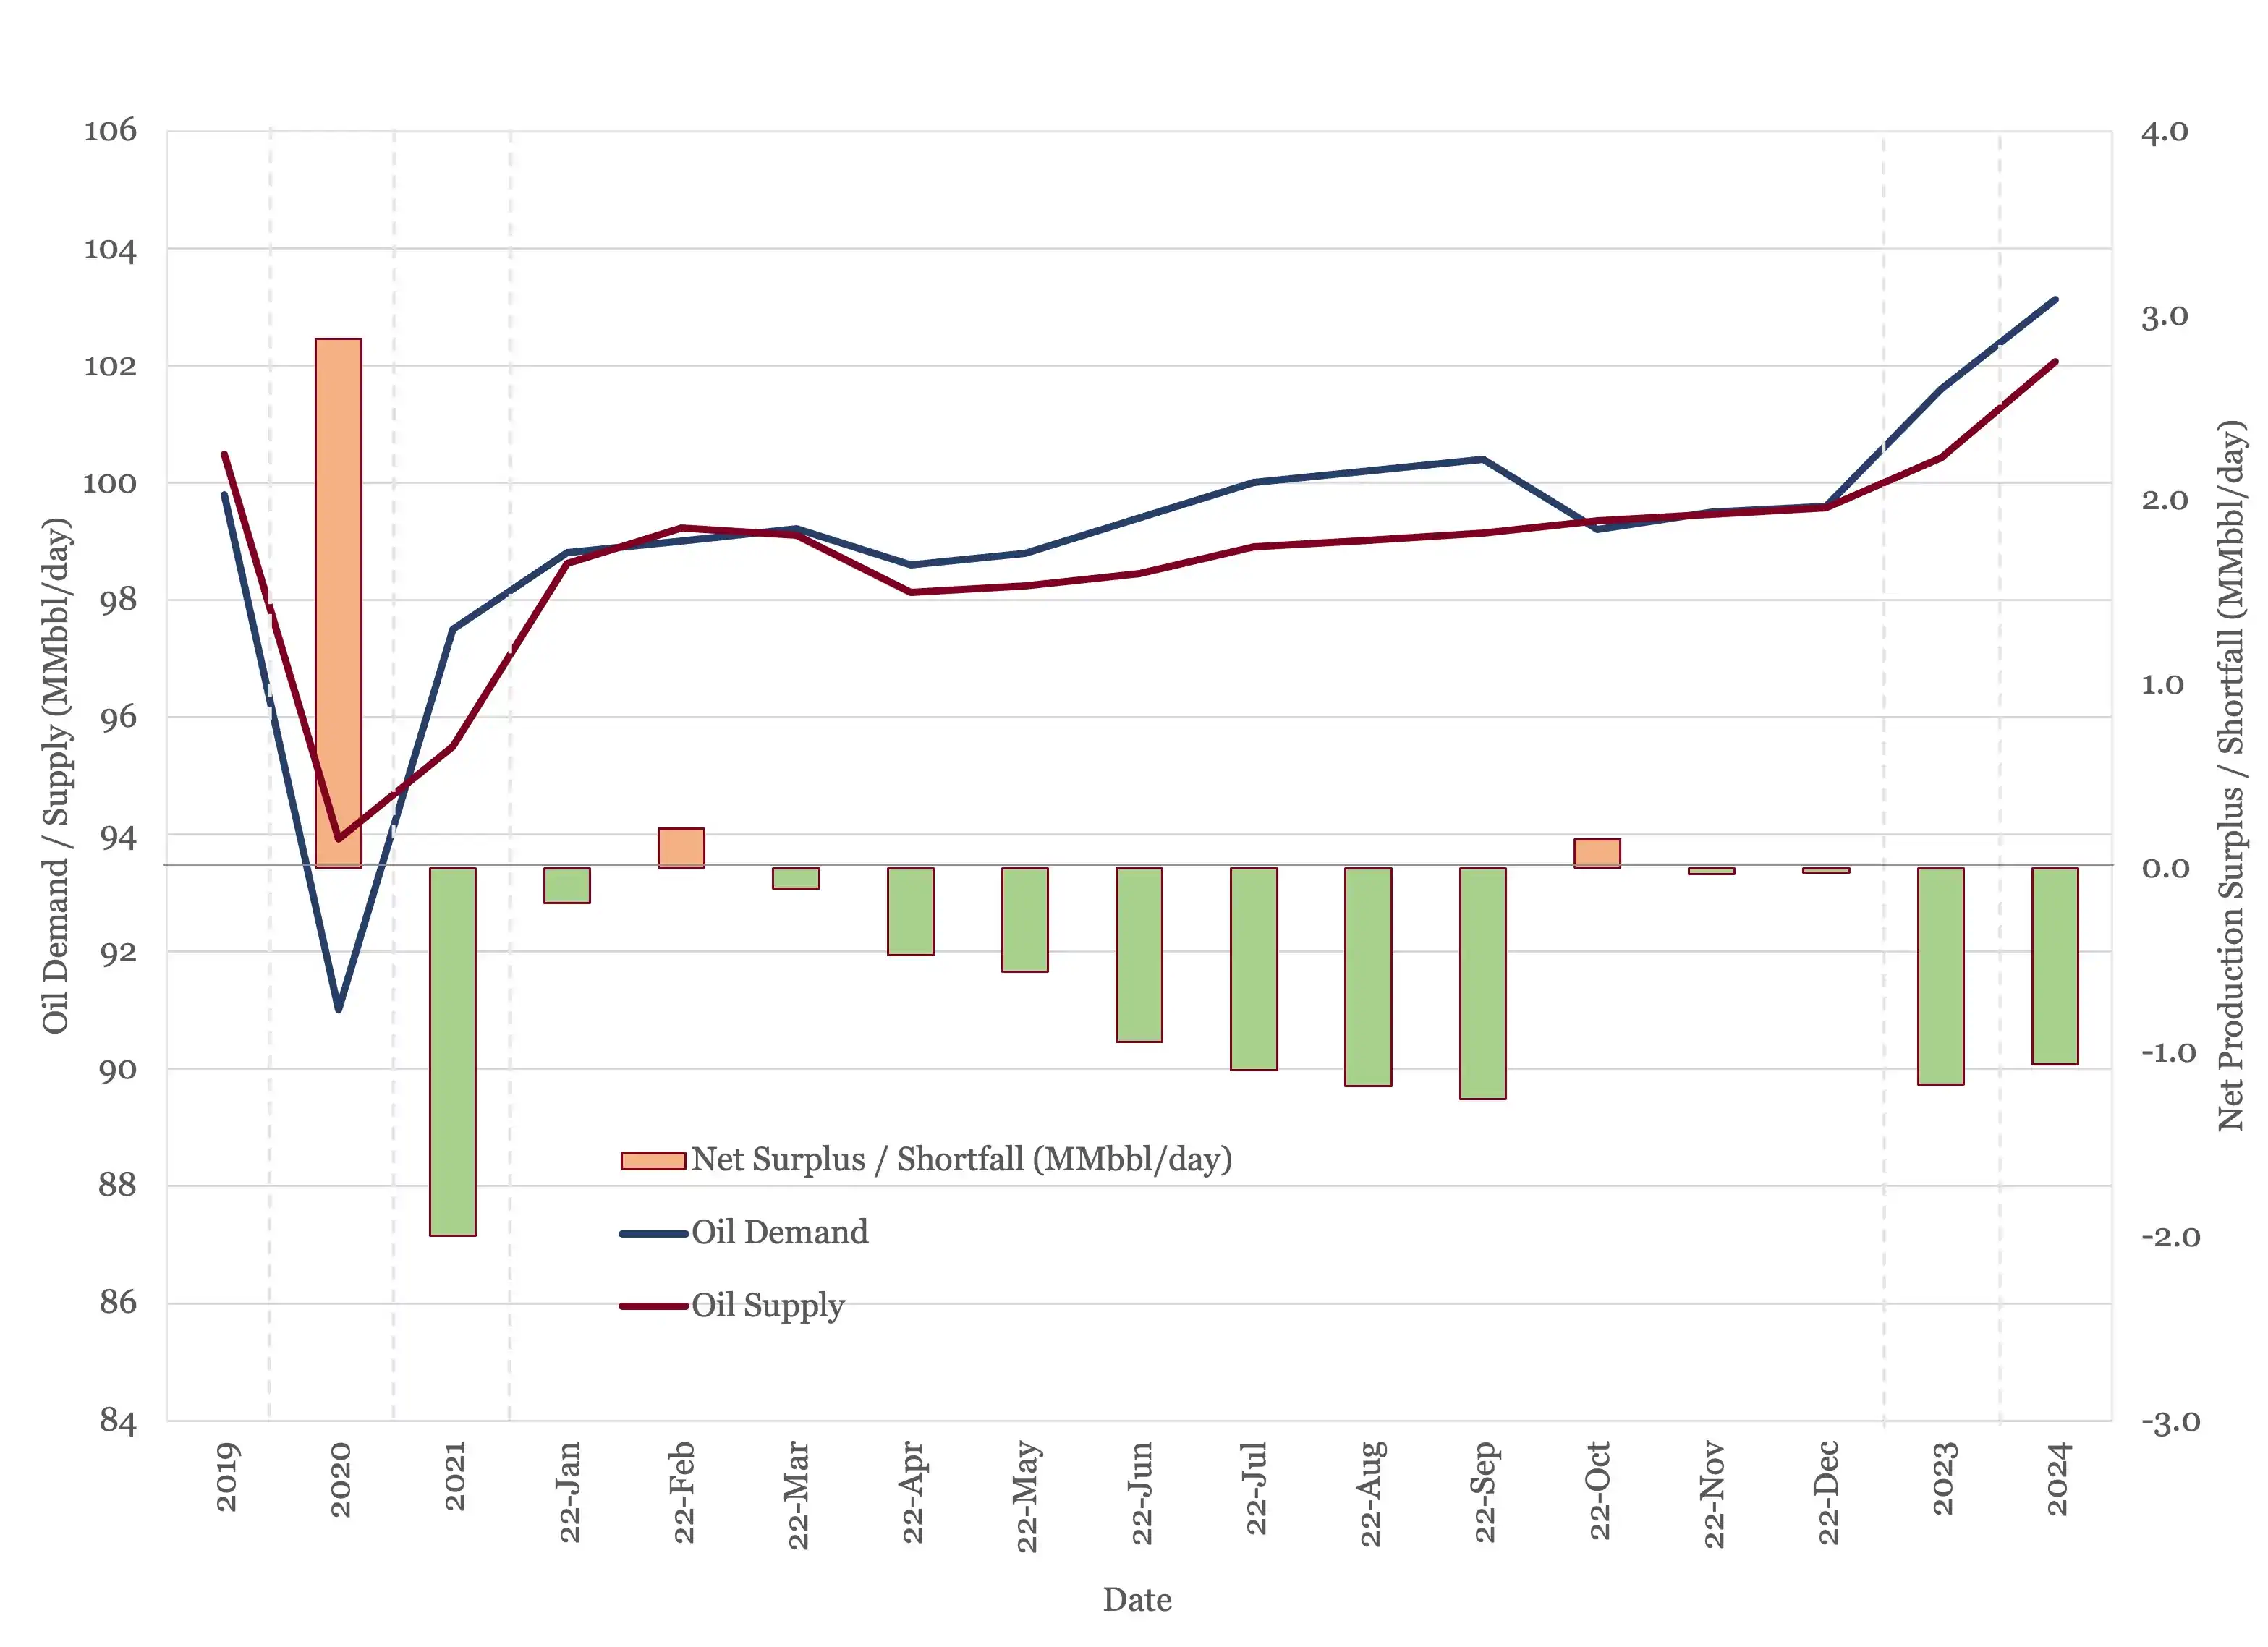
Figure 1 - Supply and Demand Surplus Forecast
Oil Storage
This month’s oil storage chart incorporates a significant 2021 upward demand revision. With this revision included, 2021 stocks fell by 728 MMbbl, rather than the 321 MMbbl reported in last month’s forecast. This was enough to push storage below the five-year average in 2021, and we expect it continue to decline throughout the year, reaching 2019 levels by year end.
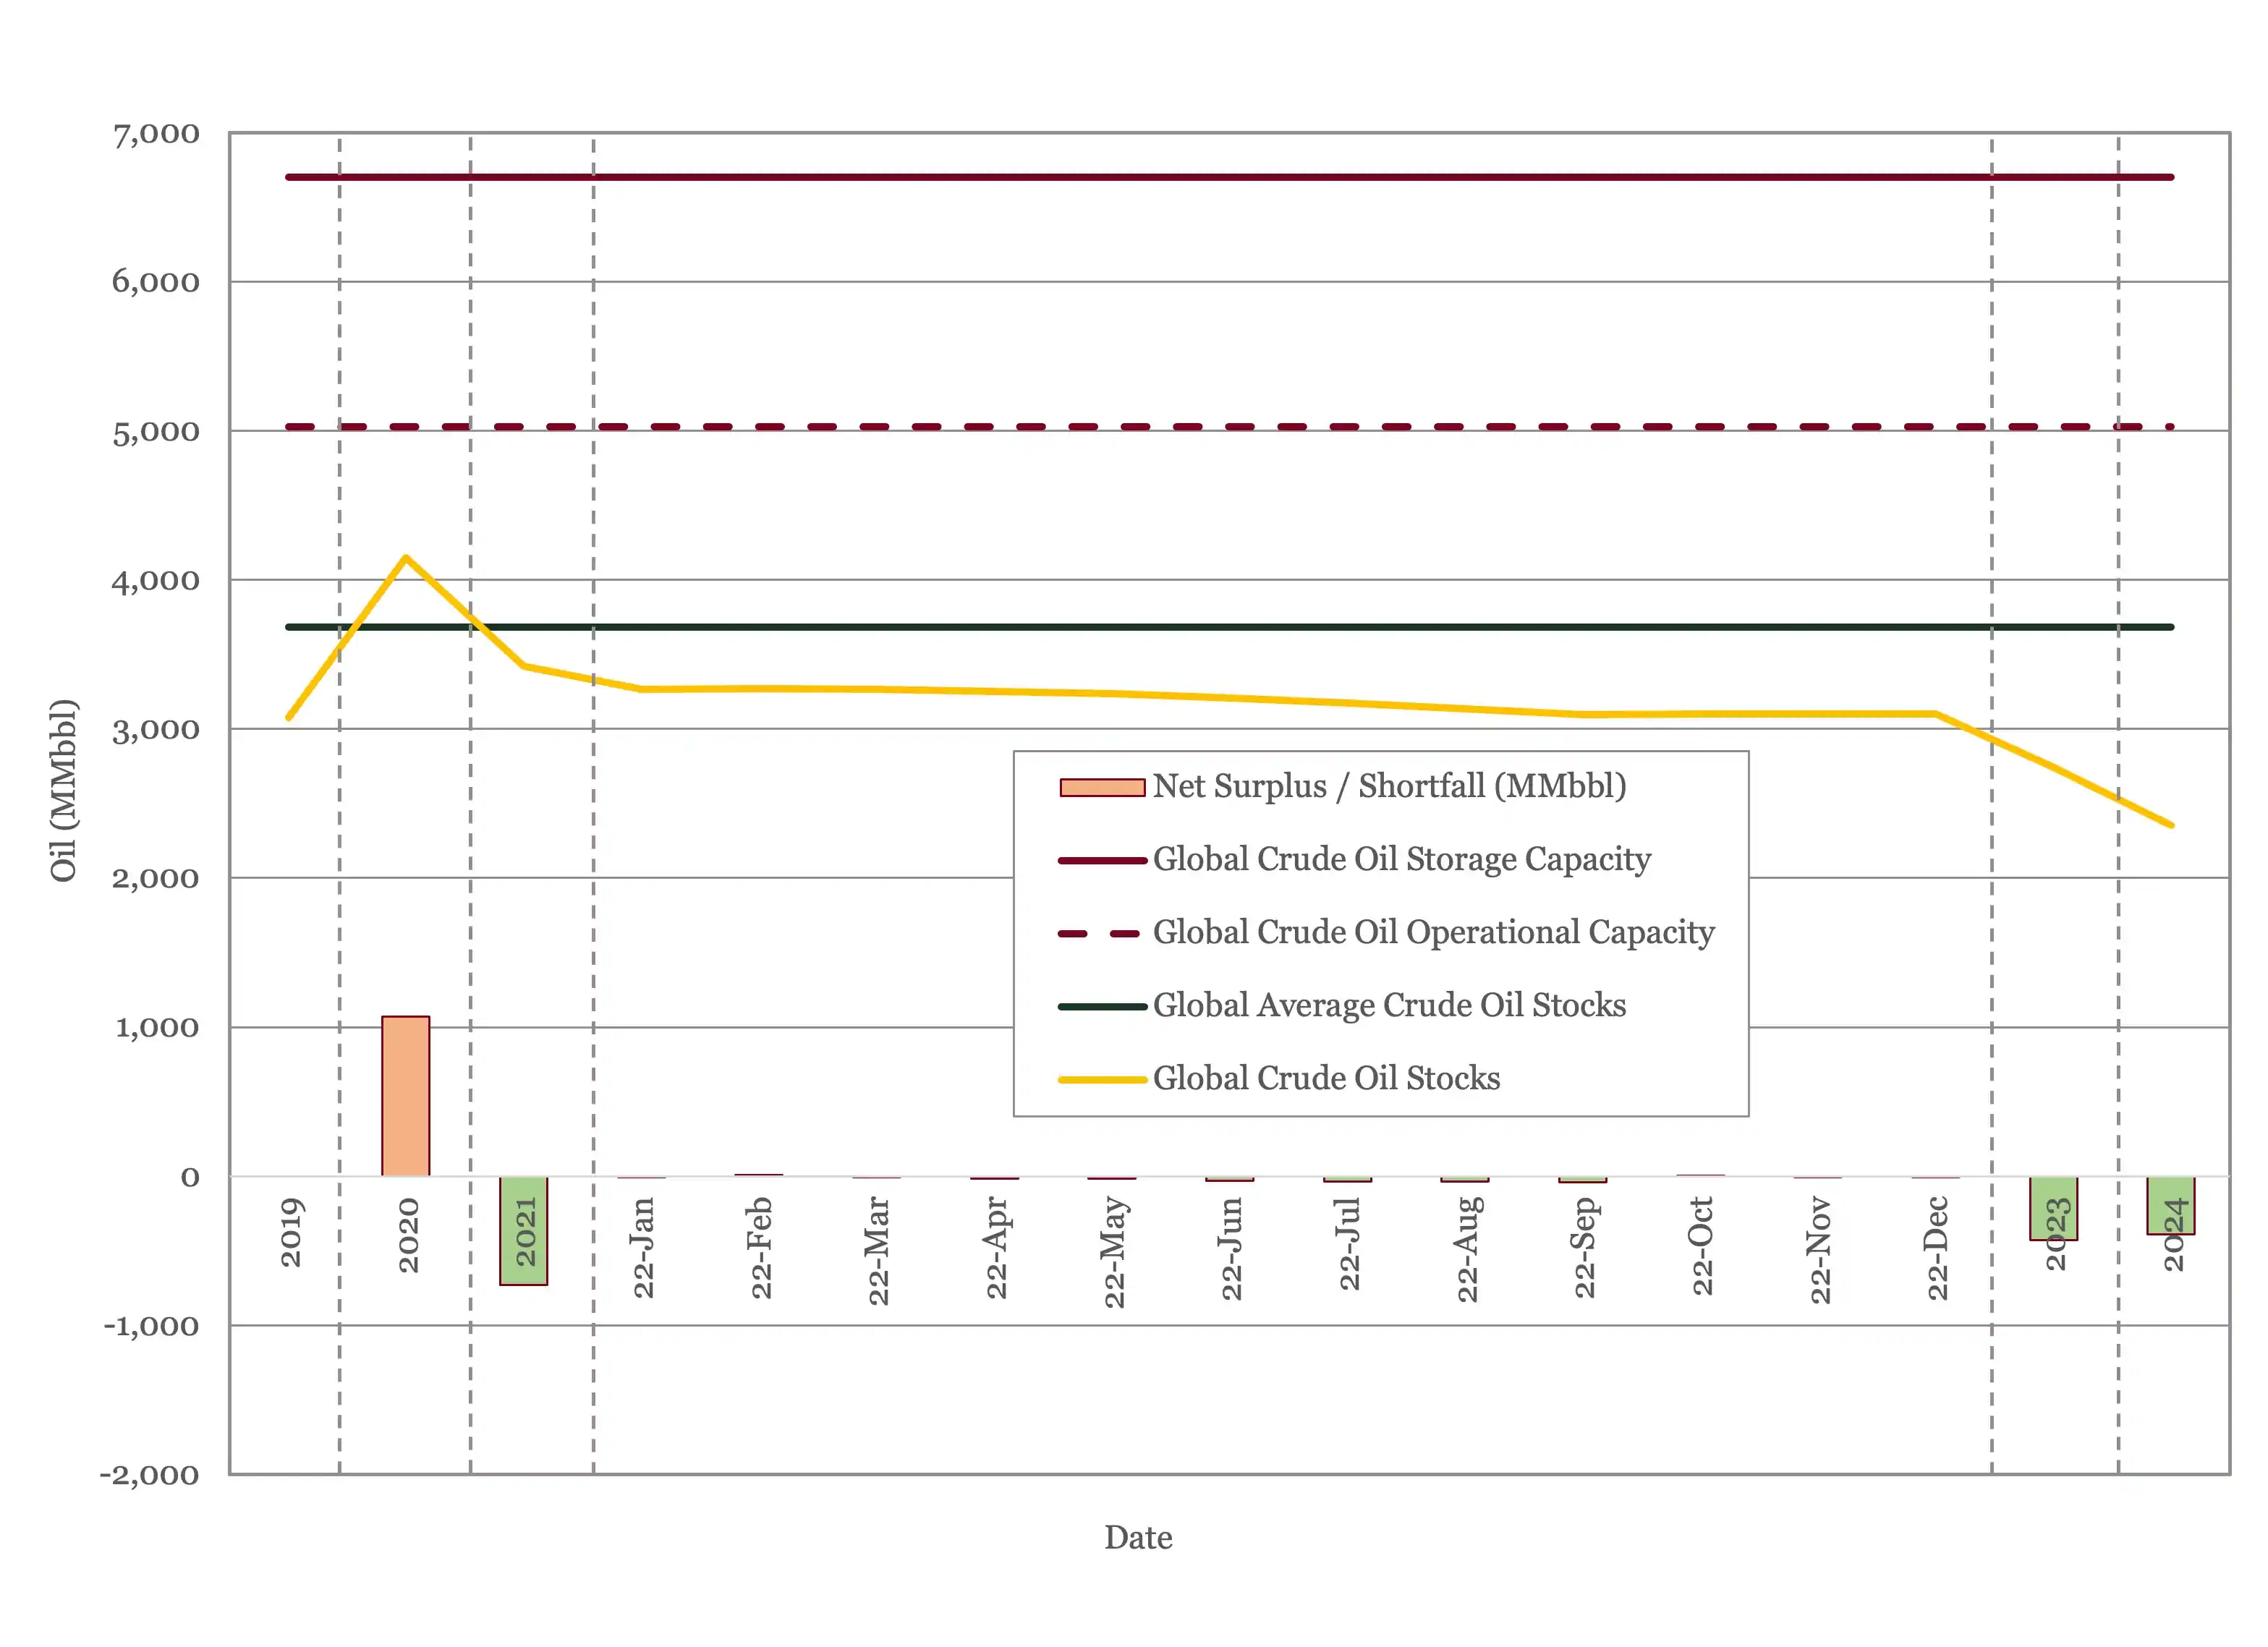
Figure 2 - Global Storage Chart
Oil Prices
At the time of writing, WTI is sitting at about $110/barrel, around where it was this time last month following a rise into the $120s in early June. Both Brent and WTI futures were up this month, through most of the contract period.
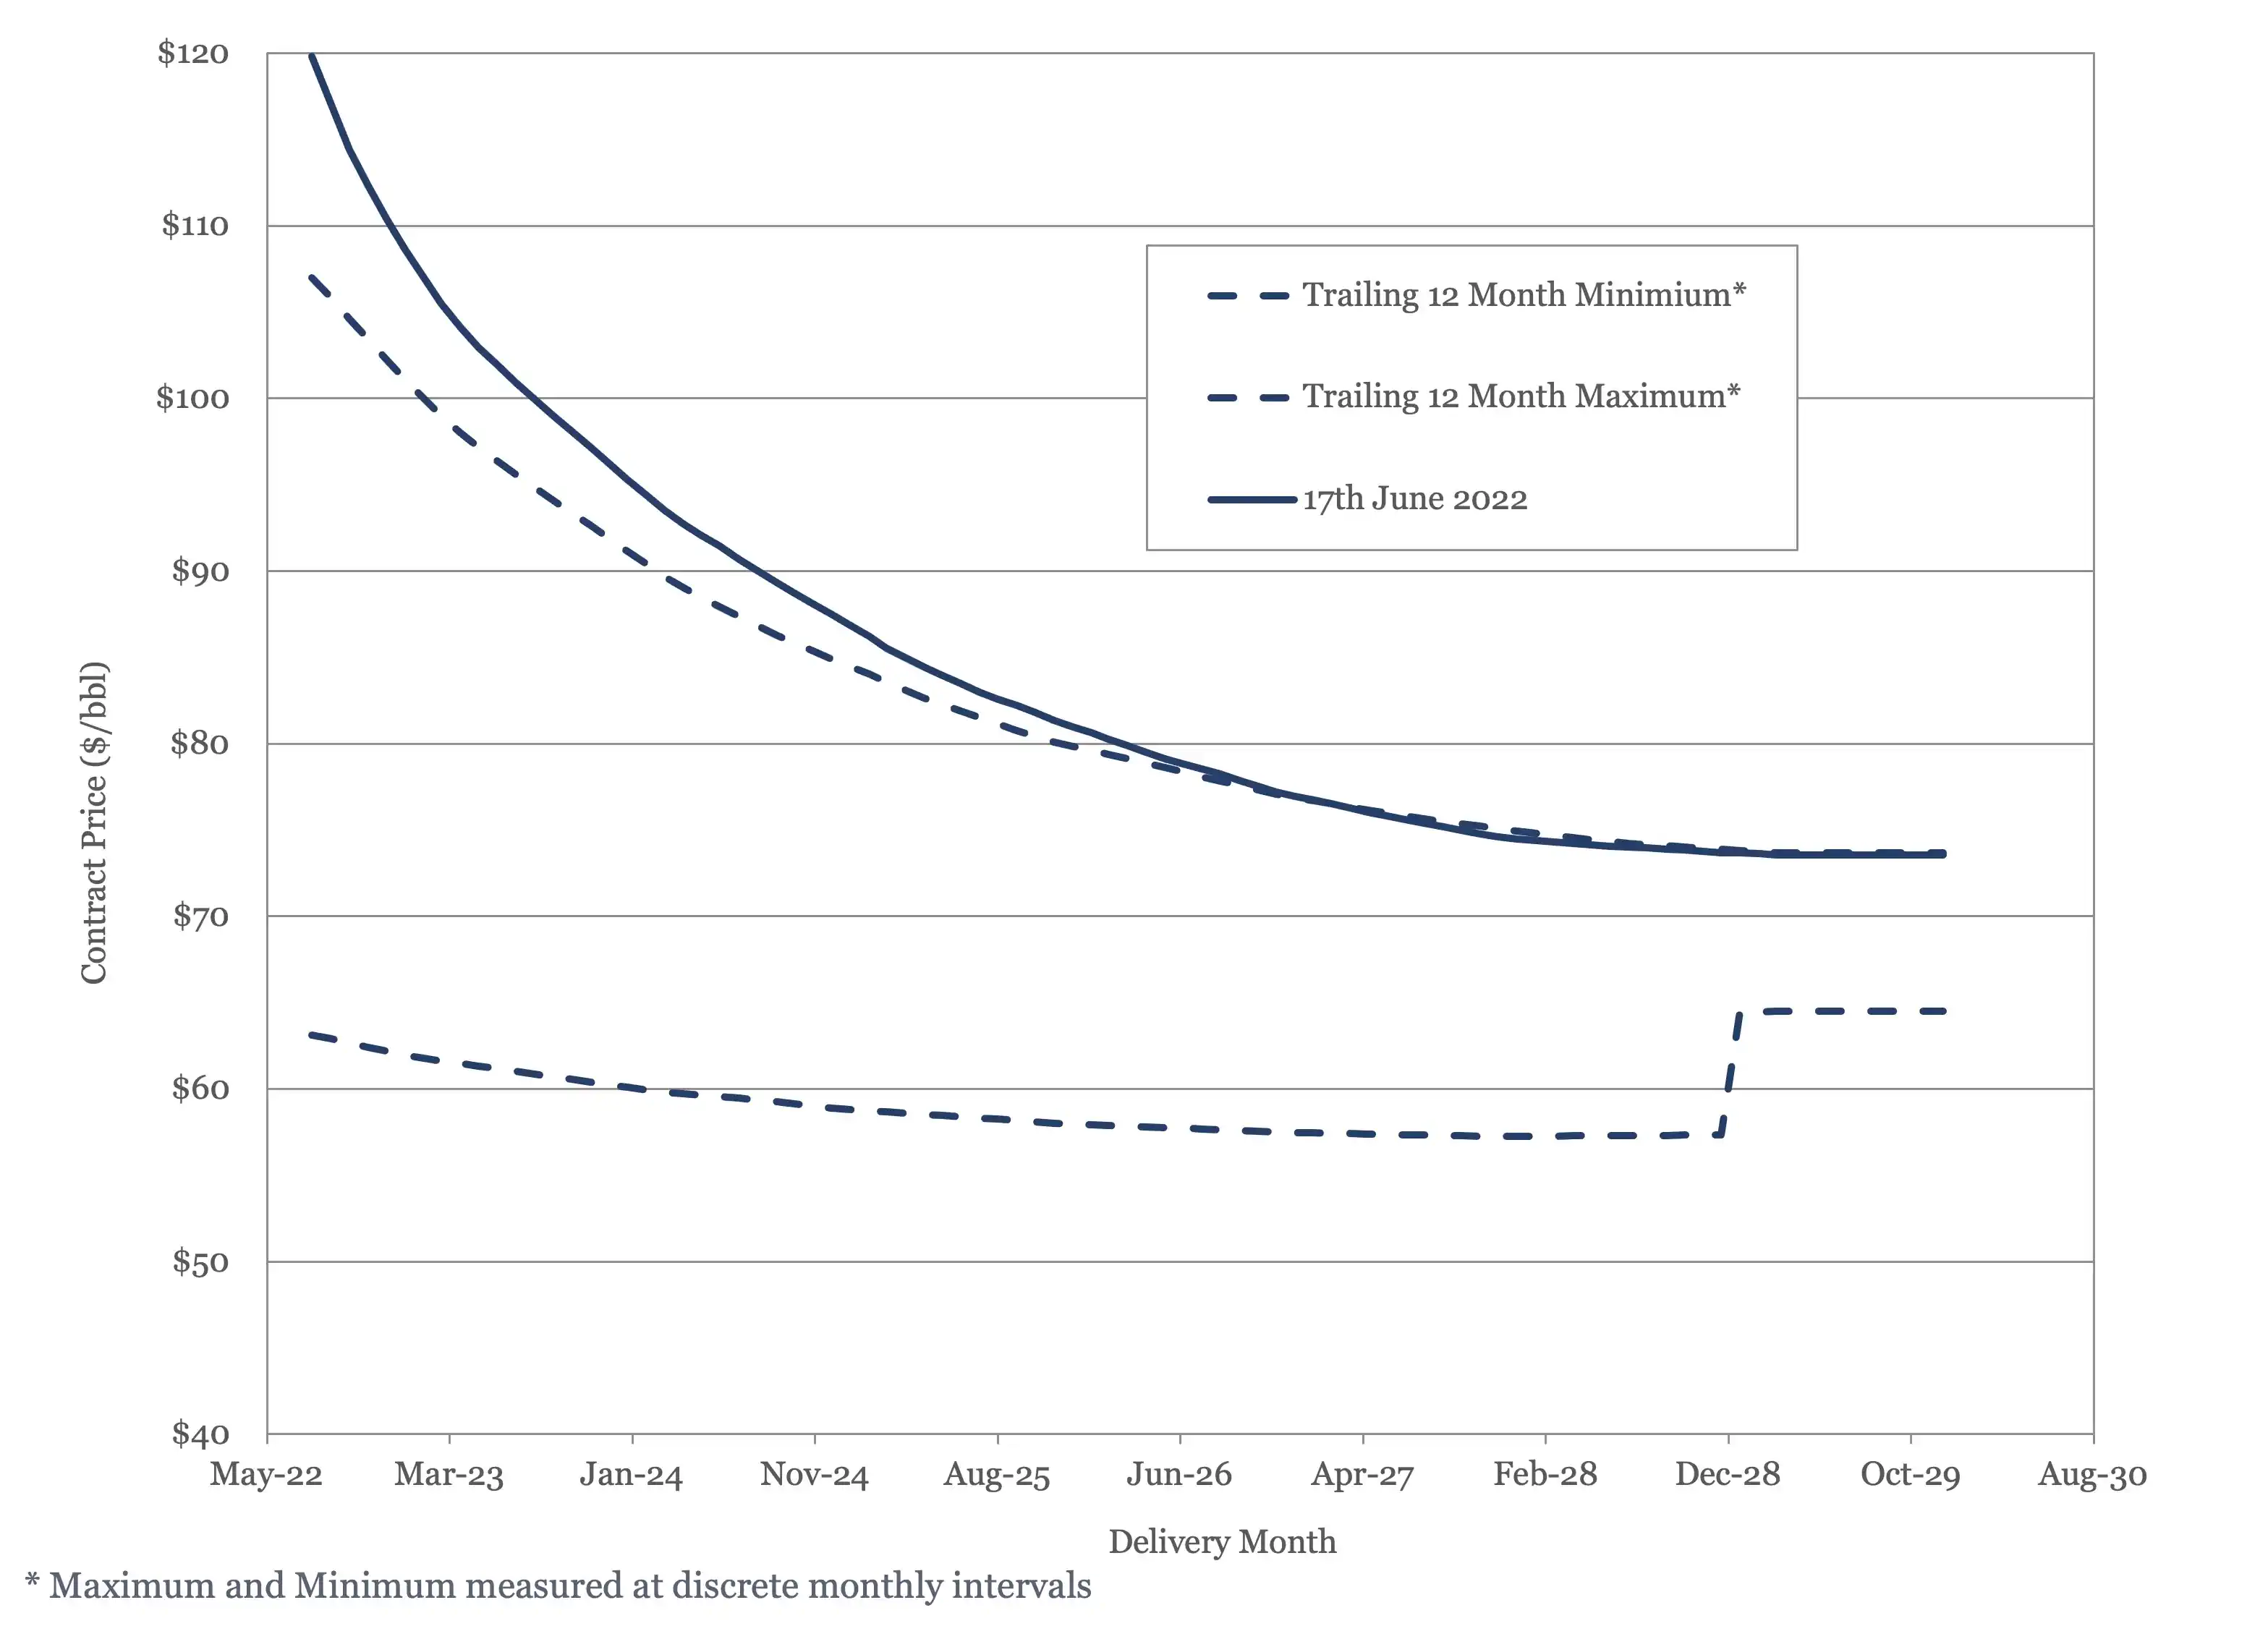
Figure 3 - Brent Crude Oil Futures

Figure 4 - WTI Crude Oil Futures
US Activity
The US land oil rig count continues to rise, hitting 563 on the 10th of June. It is currently tracking slightly above our most aggressive forecast, see Figure 5.

Figure 5 - US Land Oil Rig Count
(1) Oil Market Report – June 15th, 2022, IEA, Paris.
(2) Short Term Energy Outlook (STEO), June 7th, 2022, U.S. Energy Information Administration.
(3) “OPEC Monthly Oil Market Report”, Organization of the Petroleum Exporting Countries, June 14th, 2022.
(4) “Russia’s oil output rose last month, despite sanctions”, Stanley Reed, The New York Times, June 15th, 2022.
(5) “EU leaders agree to ban majority of Russian oil imports”, Sam Fleming, Valentina Pop and Andy Bounds, Financial Times, May 30th, 2022.
(6) “U.S., European Allies Try to Retrain Global Oil Prices”, Andrew Duehren, The Wall Street Journal, June 9th, 2022.


Explore Our Services

Business Development
Oil & Gas an extractive industry, participants must continuously find and develop new oil & gas fields as existing fields decline, making business development a continuous process.

Strategy
We approach strategy through a scenario driven assessment of the client’s current portfolio, organizational competencies, and financial framework. The strategy defines portfolio actions and coveted asset attributes.
Origination
Deal origination consists of identifying coveted assets, assets with attributes consistent with the client’s strategy, and qualified buyers. We advocate a proactive approach to business development and will undertake outreach on our client’s behalf.
Transaction Support
Transaction support consists of in depth asset evaluation, negotiation of commercial agreements or preparation of license round submission and close out of conditions. We can also aid in joint venture set up and management and asset maturation as required.