Oil Market Forecast - November 2022
Summary
November is a significant month for the oil industry. Not only does it feature the UN’s annual Conference of the Parties, climate change conference, but it is also the month when all the major reporting institutions revise their long-term oil demand forecasts. COP 27 in Egypt does not seem to have generated the same level of excitement as last year’s COP 26 in Glasgow, so in this month’s Oil Market Forecast, we will focus on the IEA and OPEC’s updated long term demand forecasts.
A few key points:
- The IEA and OPEC published new long term oil demand forecasts, with the IEA lowering their long-term outlook, while OPEC raised theirs.
- The IEA and OPEC are predicting oil demand growth through 2050 and 2040 respectively.
- Oil demand estimates for 2022 are between 99.6 MMbbl/day and 99.8MMbbl/day.
- The IEA and EIA kept their 2023 oil demand estimates flat, while OPEC downgraded theirs by 200,000 bbl/day.
- The US land oil rig count managed to break through 600, hitting 602 on the 18th of November.
Long Term Oil Demand
This is the time of year when all the major forecasting institutions publish their long-term oil demand outlooks. The IEA included updates to their Stated Policies and Announced Pledges oil demand forecasts in their World Energy Outlook 2022 (1). This followed OPEC’s 2022 World Oil Outlook 2045 (2). The EIA were scheduled to publish their International Energy Outlook 2022 in October, but at the time of writing it had yet to appear.
Starting with the IEA, we need to begin by highlighting an important point about the definition of oil. In this forecast, and all the monthly reports published by the IEA, EIA and OPEC, oil is defined as including condensate, Natural Gas Liquids (NGLs), biofuels and processing gains. This convention is applied to both supply and demand. Starting last year, the IEA applied a different definition of oil to their World Energy Outlooks. In these annual reports ‘oil’ excludes NGLs and biofuels. The IEA also provide a different category called ‘liquids’, which adds back NGLs and biofuels providing an estimate which is consistent with the convention applied elsewhere.
This seems like a minor point, but it has some important implications. World Energy Outlook 2022 was not published with the same fanfare as last year’s edition, but it did contain an announcement that oil demand would peak in 2035 under its Stated Policies scenario. When you dig into the numbers, what you find is that this is only true under their new definition of ‘oil’, as using their ‘liquids’ data set which is consistent with the conventional definition of oil, oil demand continues to rise until the end of the forecast in 2050. The IEA make their peak oil headline possible by assuming that all oil demand growth past 2030 is satisfied by biofuels, and thus under their new definition on ‘oil’ demand, not actually oil demand. This is misleading, as oil demand is oil demand and can be satisfied with either conventional oil or biofuels. In this report, we will use the conventional definition of oil demand, which uses the IEA’s ‘liquids’ data set.
Figure 1 shows a comparison of the IEA’s Stated Policies and Announced Pledges oil demand forecasts. The IEA still includes a Net Zero oil demand case in the body of the report but has not included this in its free data set for the last couple of years. This may be a tacit admission that the Net Zero case is simply unachievable. As Figure 1 shows, in the Net Zero case, oil demand would need to fall into the mid 80 MMbbl/day range next year, substantially below where it was in 2020 amid COVID-19 lockdowns. Short of another pandemic, with the same policy response, the path is simply not credible.
In terms of changes between 2021 and 2022, both Stated Policies and Announced Pledges show markedly higher demand through the 2020s’ and a steeper rollover to flatline beyond 2030. Announced Pledges shows a sharper decline this year than last year, with more demand through the mid 2030’s and less after that. The Stated Policies scenario forecasts slightly lower oil demand in 2030 than it did last year, but a similar gradient from 2030 to 2050.
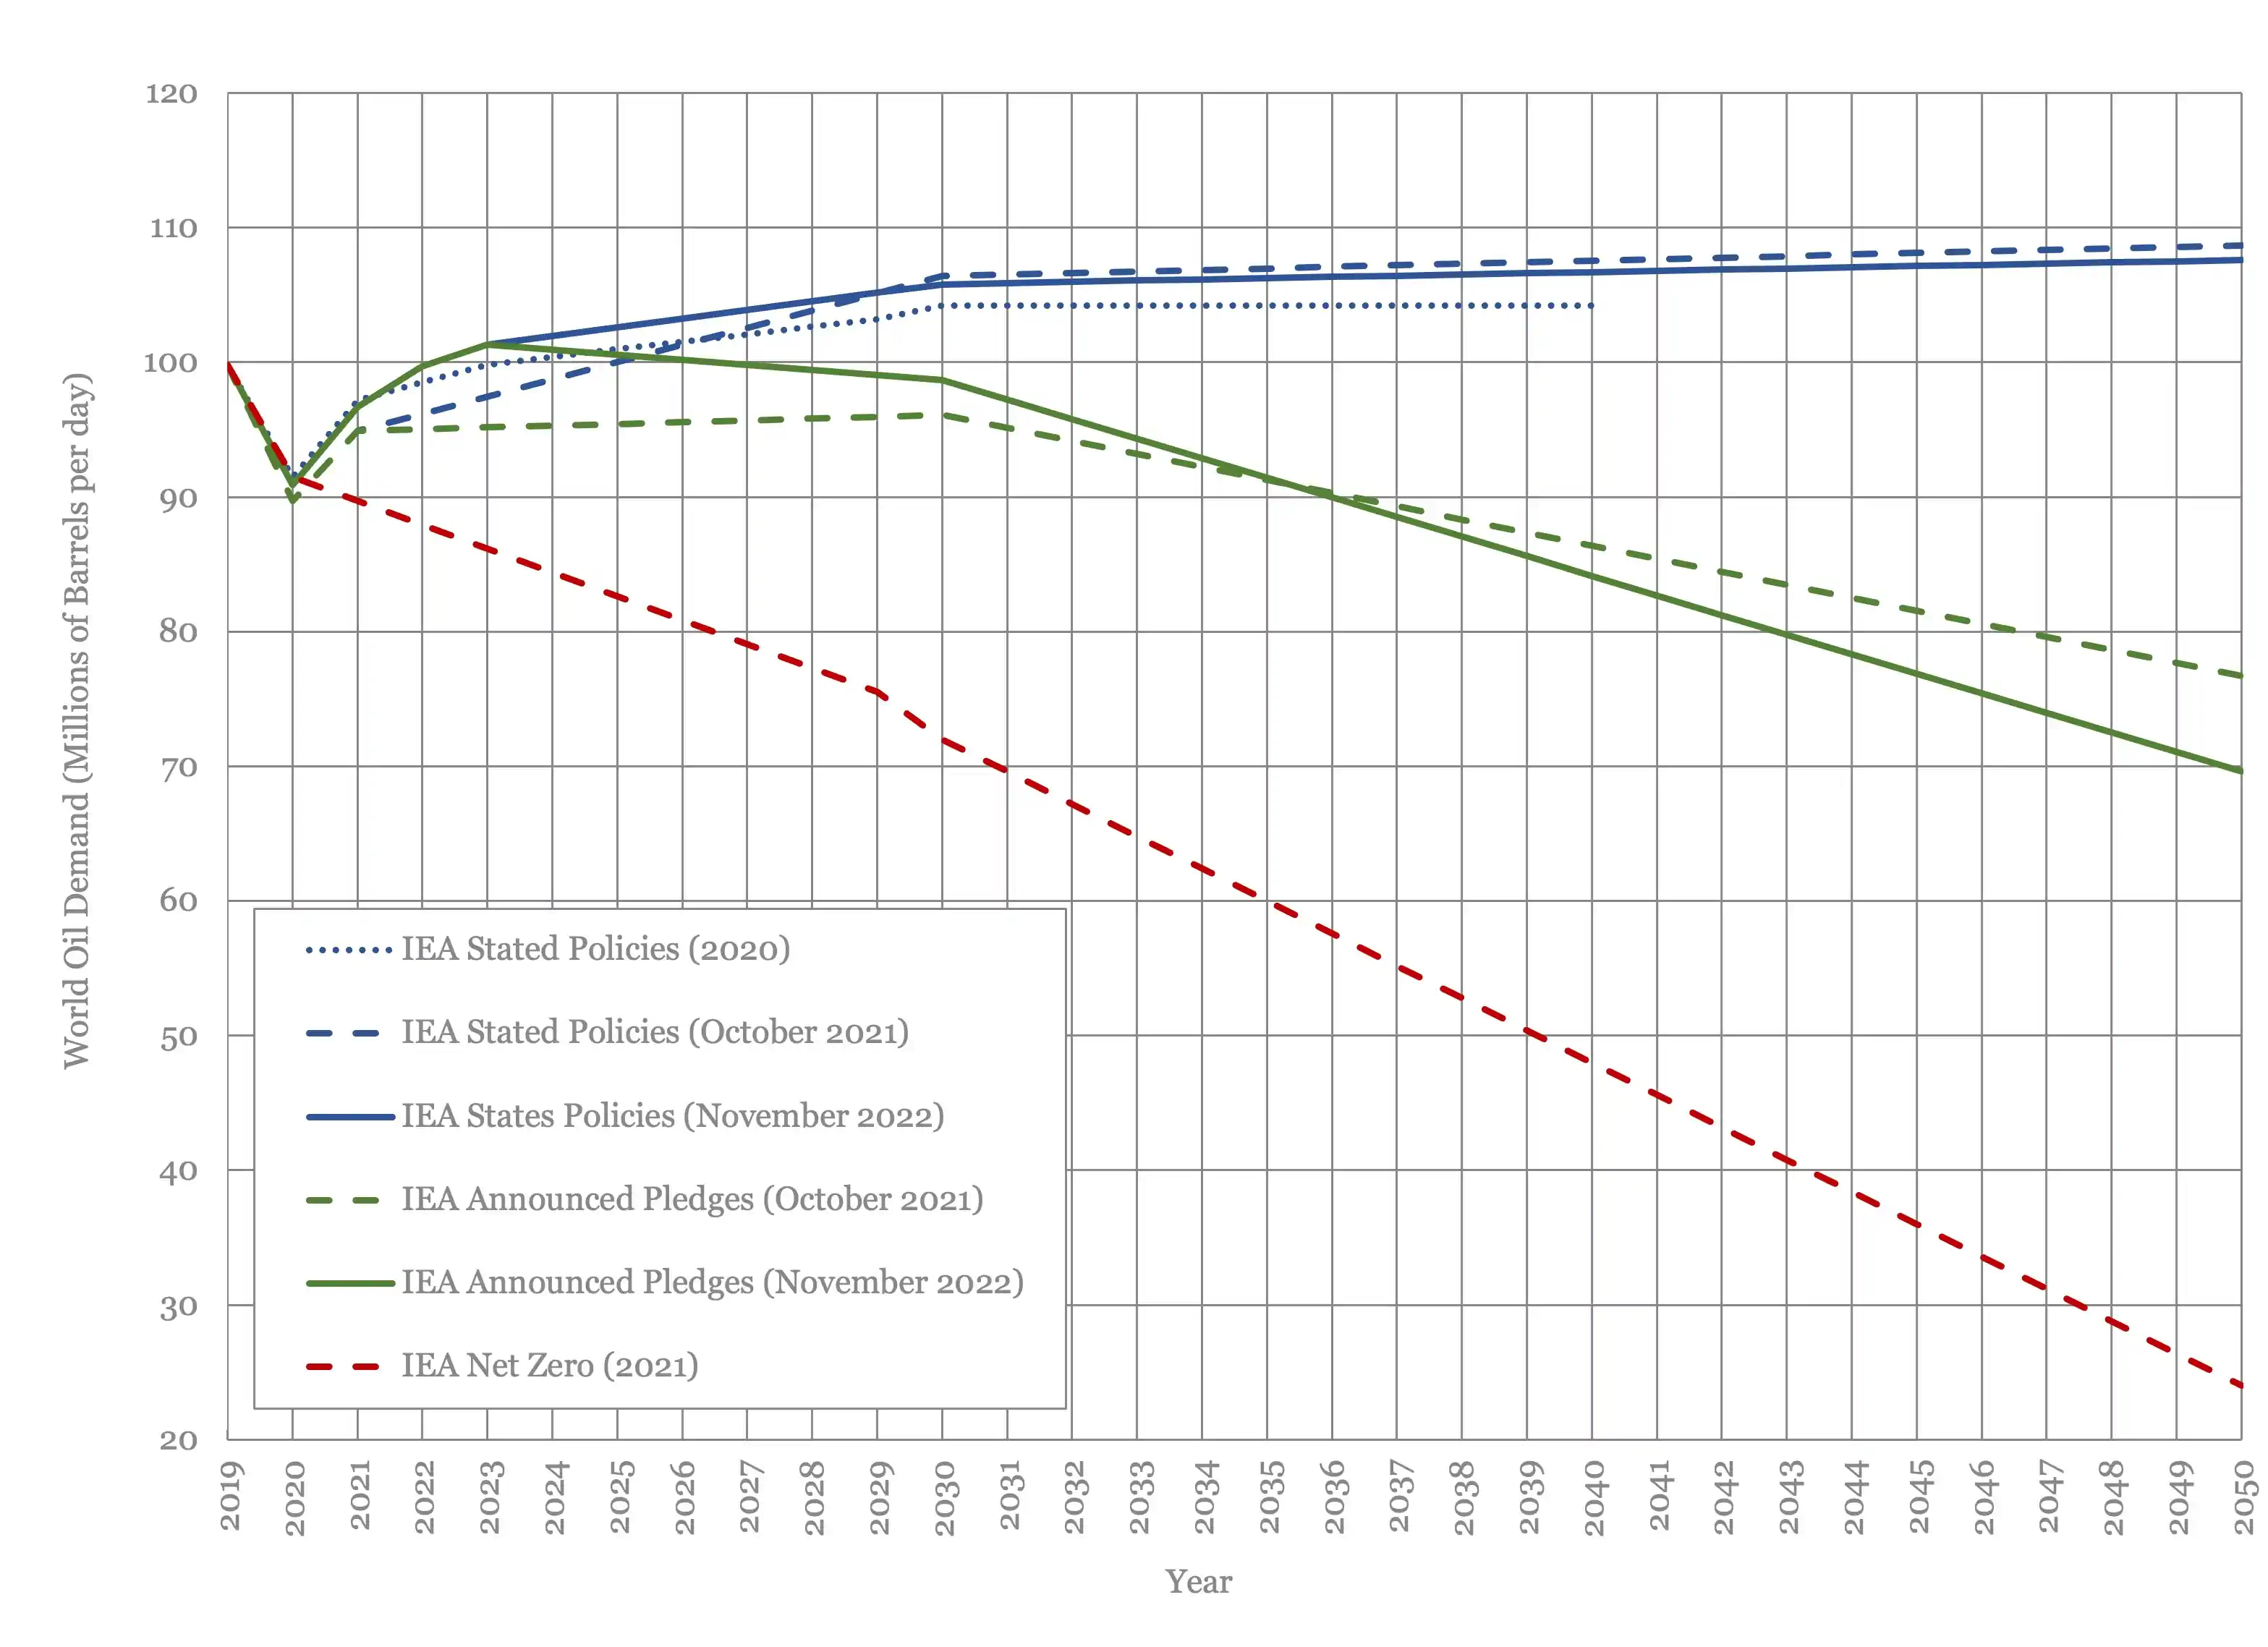
Figure 1 - IEA Long Term Oil Demand
Figure 2 shows a comparison of OPEC’s long term oil demand forecast over the last 3 years. As with the IEA, it is showing steeper near term demand growth, that while slowing after 2030, continues at a fair pace through to 2035. Beyond that, growth slows and then flatlines from 2040 onwards. OPEC has raised its long-term demand estimate, after downgrading it last year.

Figure 2 - OPEC Long Term Oil Demand Forecast
Figure 3 shows a comparison of this year’s IEA and OPEC demand forecasts, together with last year’s EIA forecast. OPEC is a little but more aggressive than the IEA, peaking at close to 109.8 MMbbl/day rather than 107.7 MMbbl/day, but the shape of the curves is similar. The EIA central forecast from 2021 remains the most optimistic for demand growth, at above 125 MMbbl/day by 2050, more than 25% above oil demand today.
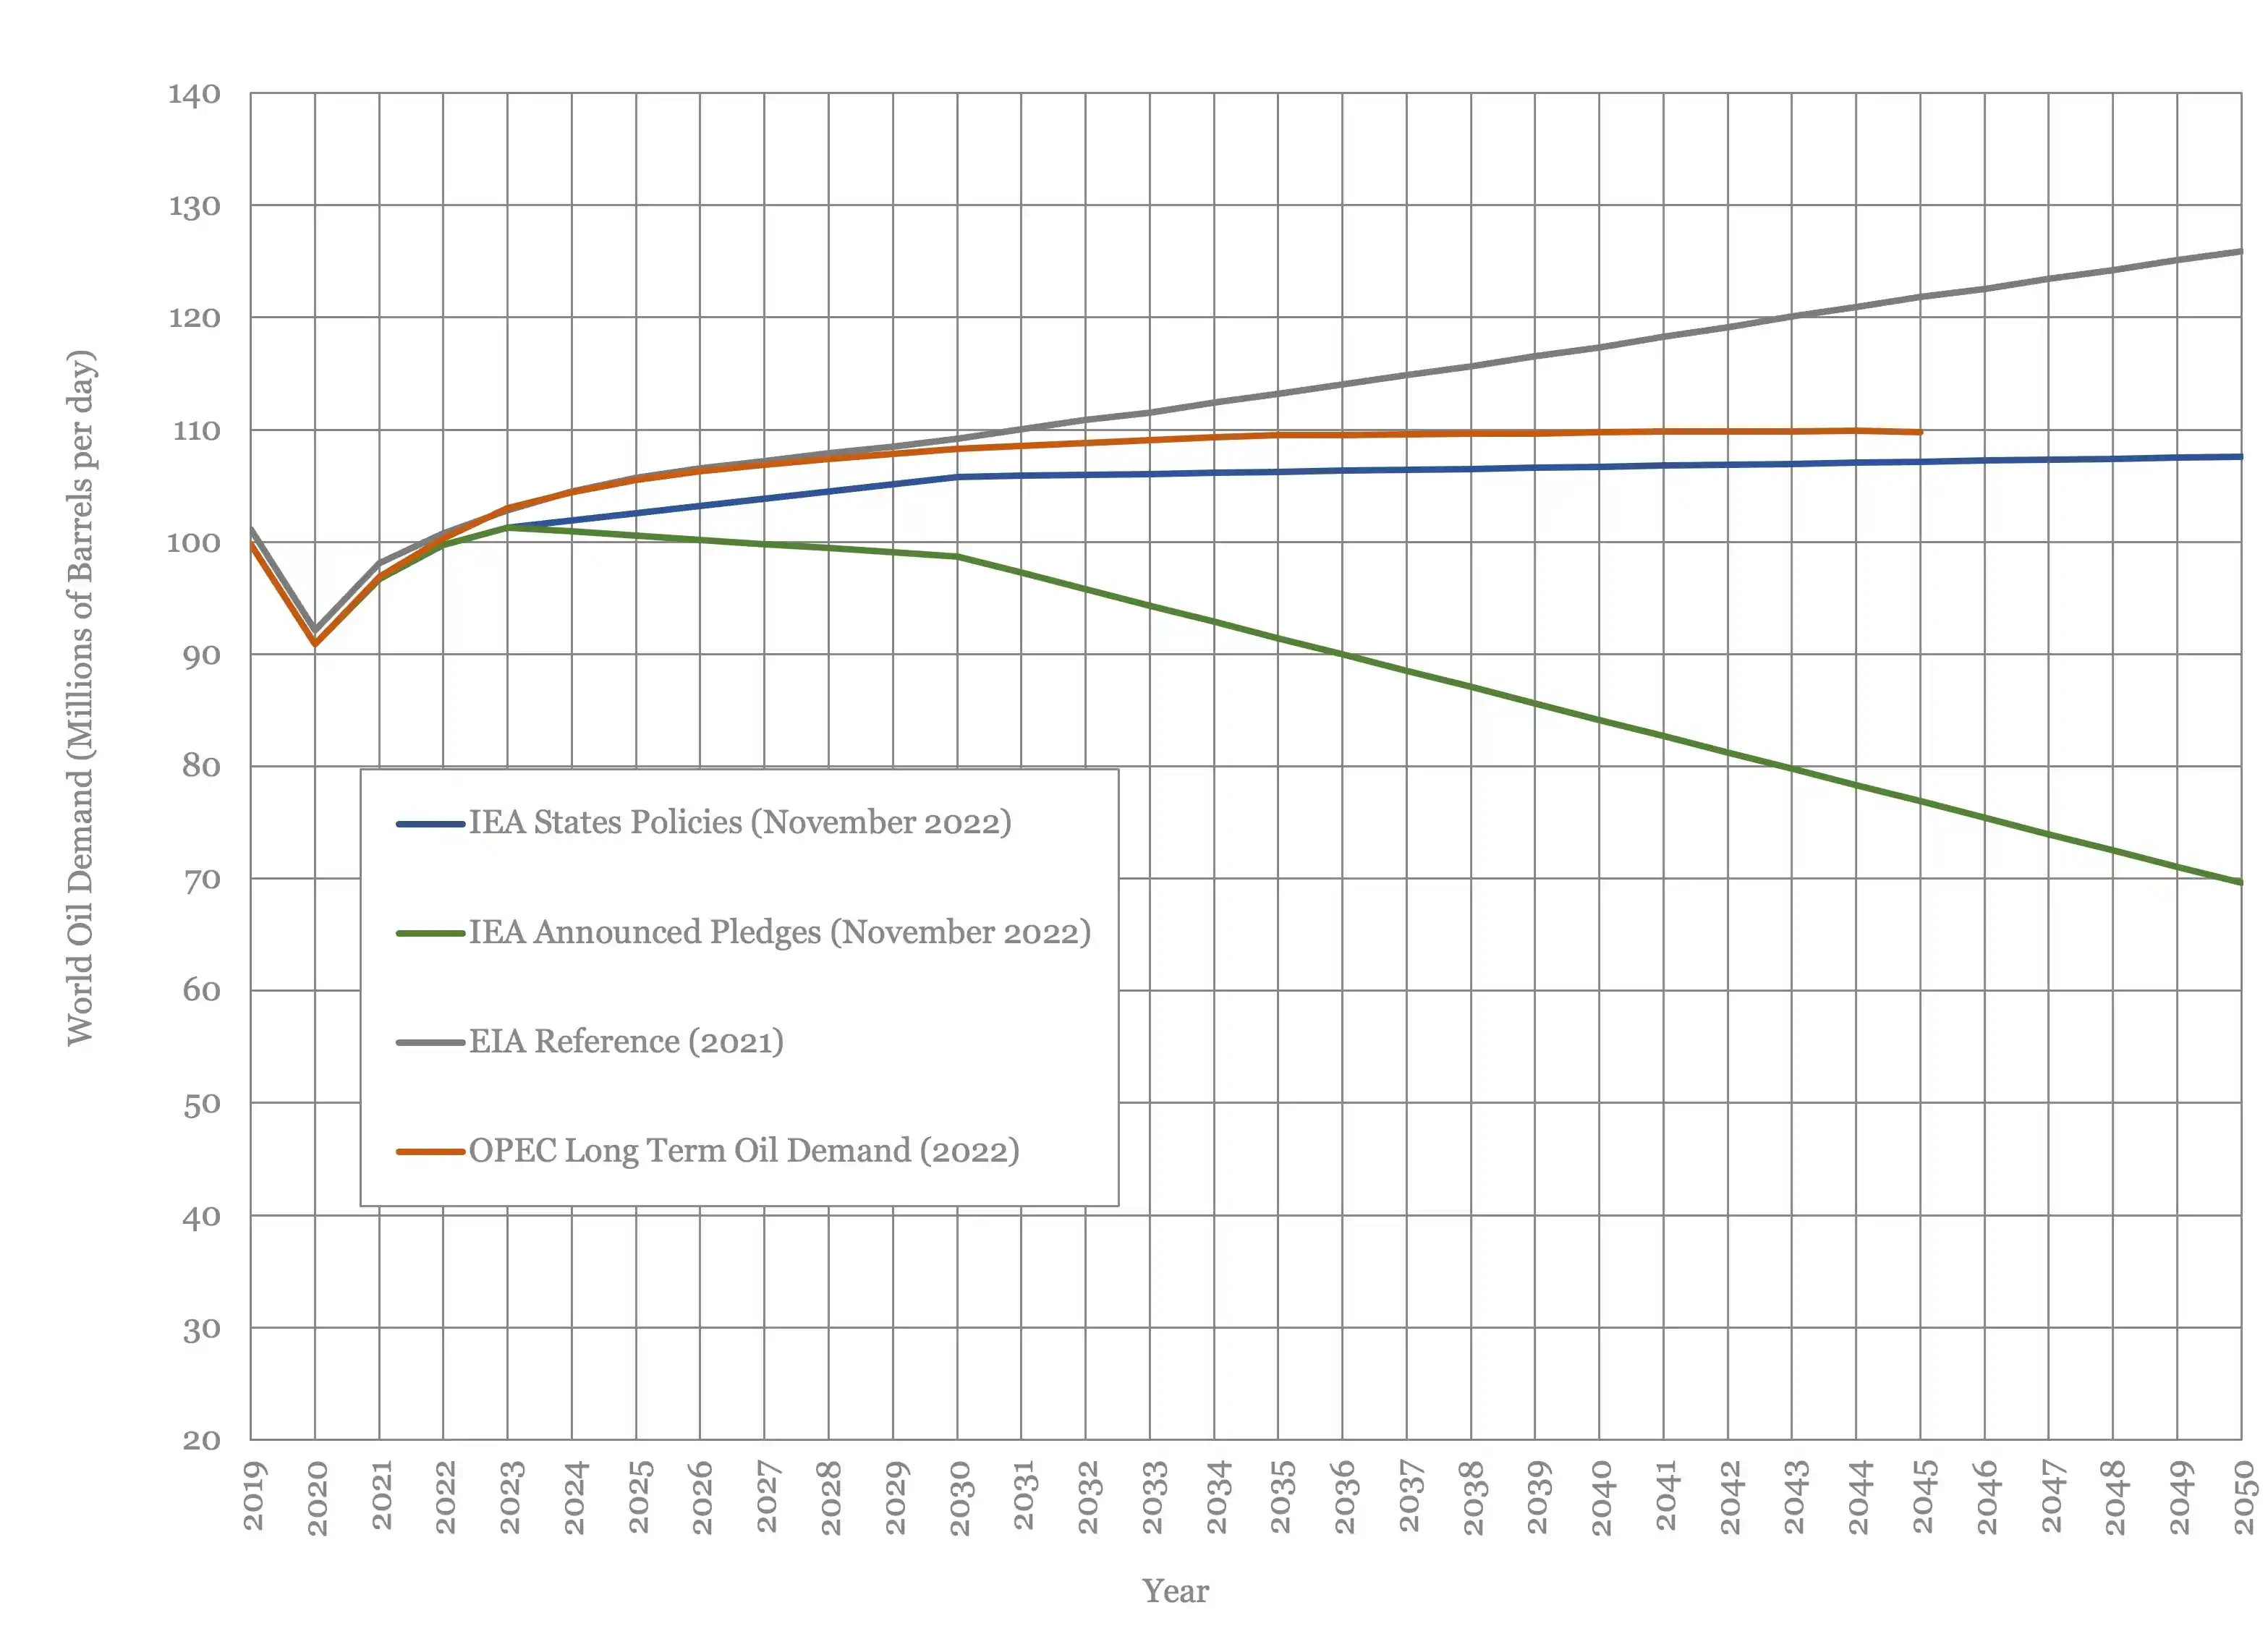
Figure 3 - Long Term Oil Demand Comparison
Considering that industry suffers from underlying production declines of the order of 5%, the demand outlook for the next 30 years, which is around the lifecycle of a field development, looks quite positive.
Oil Supply and Demand
The IEA and EIA were generally more bullish than OPEC this month. The IEA (3) and EIA (4) raised their 2022 oil demand estimate by 300,000 bbl/day and 200,000 bbl/day respectively to 99.7 MMbbl/day and 99.8 MMbbl/day. OPEC (5) lowered theirs by 100,000 bbl/day to 99.6 MMbbl/day. As expected, oil demand forecasts are moving into a tight band as the year draws to a close.
The estimated oil demand spread for 2023 is wider, with the IEA and EIA holding steady at 101.3 MMbbl/day and 101 MMbbl/day respectively. OPEC downgraded their 2023 oil demand outlook by 200,000 bbl/day to 101.8 MMbbl/day.
On the supply side, OPEC+ have moved to bi-monthly meeting, so we should not expect a quota adjustment until December this year. We estimate supply this month will fall by nearly 1.2 MMbbl/day to 99.5 MMbbl/day as OPEC+’s revised quotas become effective. This moves the oil market from a slight surplus to a sharp deficit, with the outlook for it to remain tight for the rest of the forecast period.

Figure 4 - Supply and Demand Forecast
Oil Storage
The recent round of OPEC+ production cuts have pushed what was a flat 2022 into a stock draw of 53 MMbbl. The picture next year, if the latest targets are maintained, is a much larger stock draw of 662 MMbbl, close to the kind of drawdown OPEC+ managed in 2021.
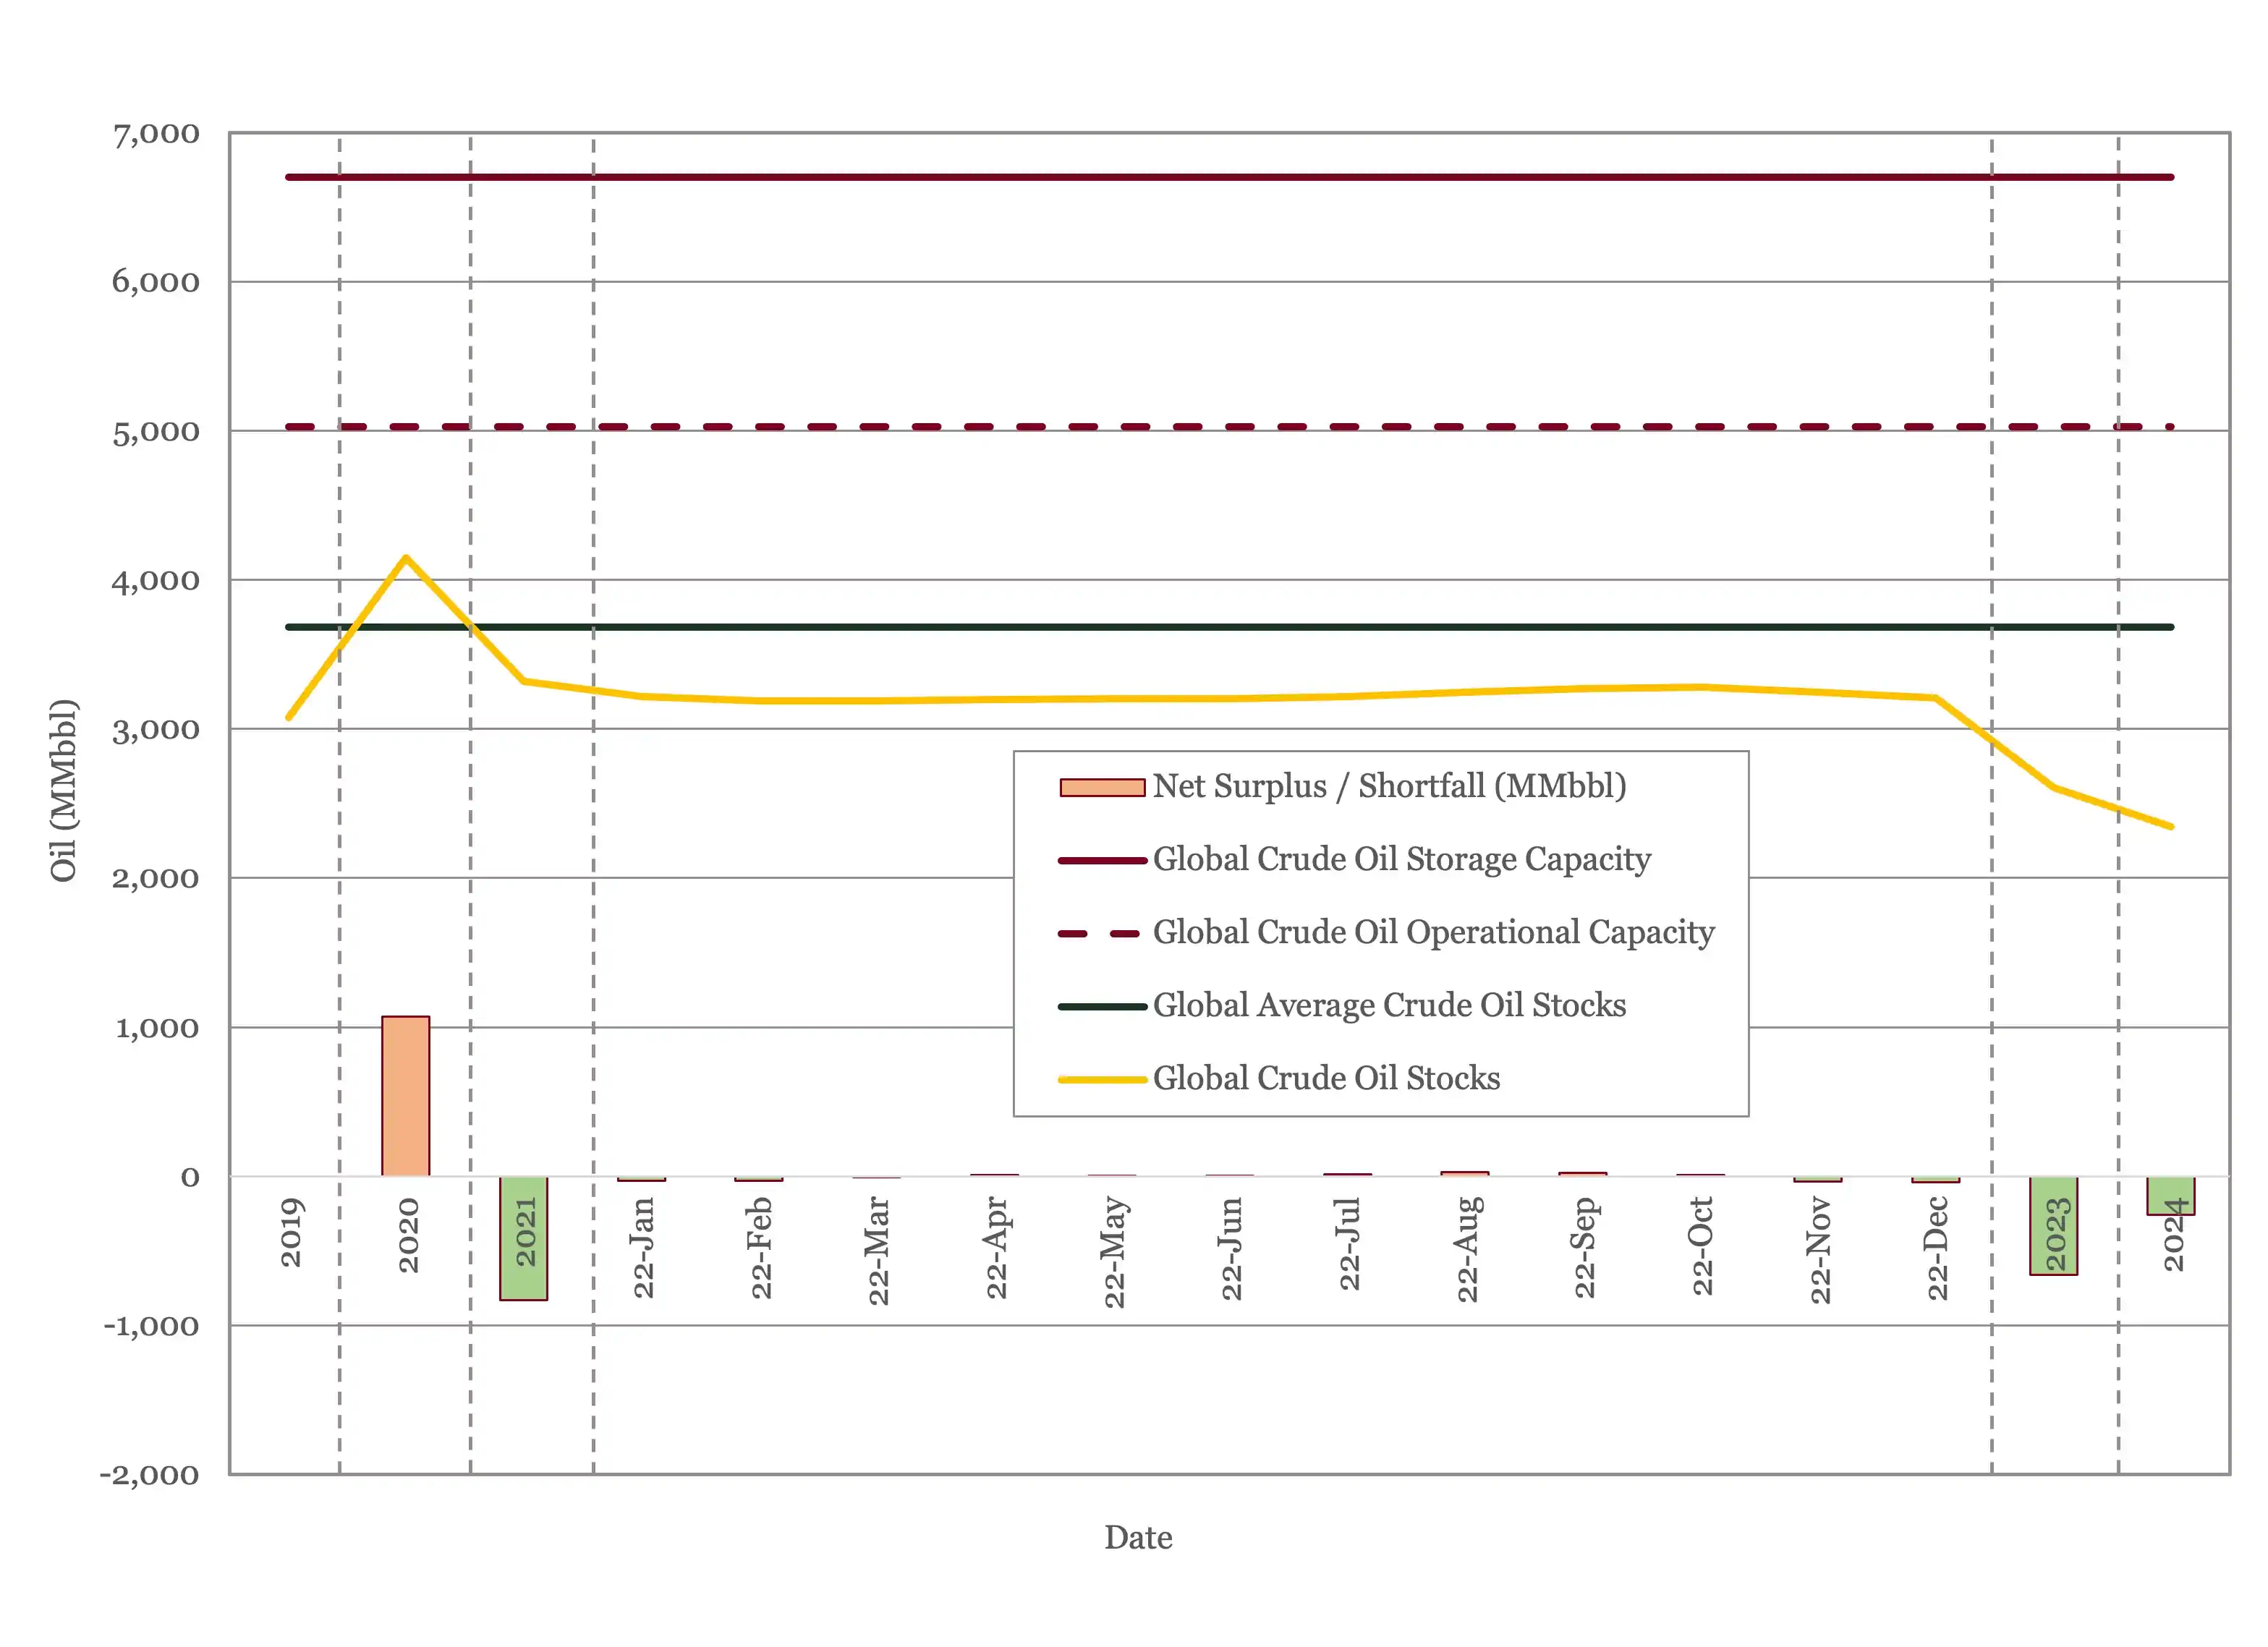
Figure 5 - Global Storage Chart
Oil Prices
After rising in late October, crude oil spot prices have drifted down to around $80/bbl WTI and $87/bbl Brent at the time or writing. Near term futures are down slightly this month but have risen further out on the maturity curve.

Figure 6 - Brent Crude Oil Futures

Figure 7 - WTI Oil Futures
US Activity
The US land oil rig count managed to break 600 this month, landing at 602 on November 18th. The rig count seems to have moved back onto an upward path, having seemed to have stalled over the summer.

Figure 8 - US Land Oil Rig Count
(1) “World Energy Outlook 2022”, November 2022, IEA, Paris.
(2) “2022 World Oil Outlook 2045”, October 2022, Organization of the Petroleum Exporting Countries
(3) Oil Market Report – November 15th, 2022, IEA, Paris.
(4) Short Term Energy Outlook (STEO), November 3rd, 2022, U.S. Energy Information Administration.
(5) “OPEC Monthly Oil Market Report”, Organization of the Petroleum Exporting Countries, November14th, 2022.


Oil Market Forecast - November 2022
Summary
November is a significant month for the oil industry. Not only does it feature the UN’s annual Conference of the Parties, climate change conference, but it is also the month when all the major reporting institutions revise their long-term oil demand forecasts. COP 27 in Egypt does not seem to have generated the same level of excitement as last year’s COP 26 in Glasgow, so in this month’s Oil Market Forecast, we will focus on the IEA and OPEC’s updated long term demand forecasts.
A few key points:
- The IEA and OPEC published new long term oil demand forecasts, with the IEA lowering their long-term outlook, while OPEC raised theirs.
- The IEA and OPEC are predicting oil demand growth through 2050 and 2040 respectively.
- Oil demand estimates for 2022 are between 99.6 MMbbl/day and 99.8MMbbl/day.
- The IEA and EIA kept their 2023 oil demand estimates flat, while OPEC downgraded theirs by 200,000 bbl/day.
- The US land oil rig count managed to break through 600, hitting 602 on the 18th of November.
Long Term Oil Demand
This is the time of year when all the major forecasting institutions publish their long-term oil demand outlooks. The IEA included updates to their Stated Policies and Announced Pledges oil demand forecasts in their World Energy Outlook 2022 (1). This followed OPEC’s 2022 World Oil Outlook 2045 (2). The EIA were scheduled to publish their International Energy Outlook 2022 in October, but at the time of writing it had yet to appear.
Starting with the IEA, we need to begin by highlighting an important point about the definition of oil. In this forecast, and all the monthly reports published by the IEA, EIA and OPEC, oil is defined as including condensate, Natural Gas Liquids (NGLs), biofuels and processing gains. This convention is applied to both supply and demand. Starting last year, the IEA applied a different definition of oil to their World Energy Outlooks. In these annual reports ‘oil’ excludes NGLs and biofuels. The IEA also provide a different category called ‘liquids’, which adds back NGLs and biofuels providing an estimate which is consistent with the convention applied elsewhere.
This seems like a minor point, but it has some important implications. World Energy Outlook 2022 was not published with the same fanfare as last year’s edition, but it did contain an announcement that oil demand would peak in 2035 under its Stated Policies scenario. When you dig into the numbers, what you find is that this is only true under their new definition of ‘oil’, as using their ‘liquids’ data set which is consistent with the conventional definition of oil, oil demand continues to rise until the end of the forecast in 2050. The IEA make their peak oil headline possible by assuming that all oil demand growth past 2030 is satisfied by biofuels, and thus under their new definition on ‘oil’ demand, not actually oil demand. This is misleading, as oil demand is oil demand and can be satisfied with either conventional oil or biofuels. In this report, we will use the conventional definition of oil demand, which uses the IEA’s ‘liquids’ data set.
Figure 1 shows a comparison of the IEA’s Stated Policies and Announced Pledges oil demand forecasts. The IEA still includes a Net Zero oil demand case in the body of the report but has not included this in its free data set for the last couple of years. This may be a tacit admission that the Net Zero case is simply unachievable. As Figure 1 shows, in the Net Zero case, oil demand would need to fall into the mid 80 MMbbl/day range next year, substantially below where it was in 2020 amid COVID-19 lockdowns. Short of another pandemic, with the same policy response, the path is simply not credible.
In terms of changes between 2021 and 2022, both Stated Policies and Announced Pledges show markedly higher demand through the 2020s’ and a steeper rollover to flatline beyond 2030. Announced Pledges shows a sharper decline this year than last year, with more demand through the mid 2030’s and less after that. The Stated Policies scenario forecasts slightly lower oil demand in 2030 than it did last year, but a similar gradient from 2030 to 2050.

Figure 1 - IEA Long Term Oil Demand
Figure 2 shows a comparison of OPEC’s long term oil demand forecast over the last 3 years. As with the IEA, it is showing steeper near term demand growth, that while slowing after 2030, continues at a fair pace through to 2035. Beyond that, growth slows and then flatlines from 2040 onwards. OPEC has raised its long-term demand estimate, after downgrading it last year.
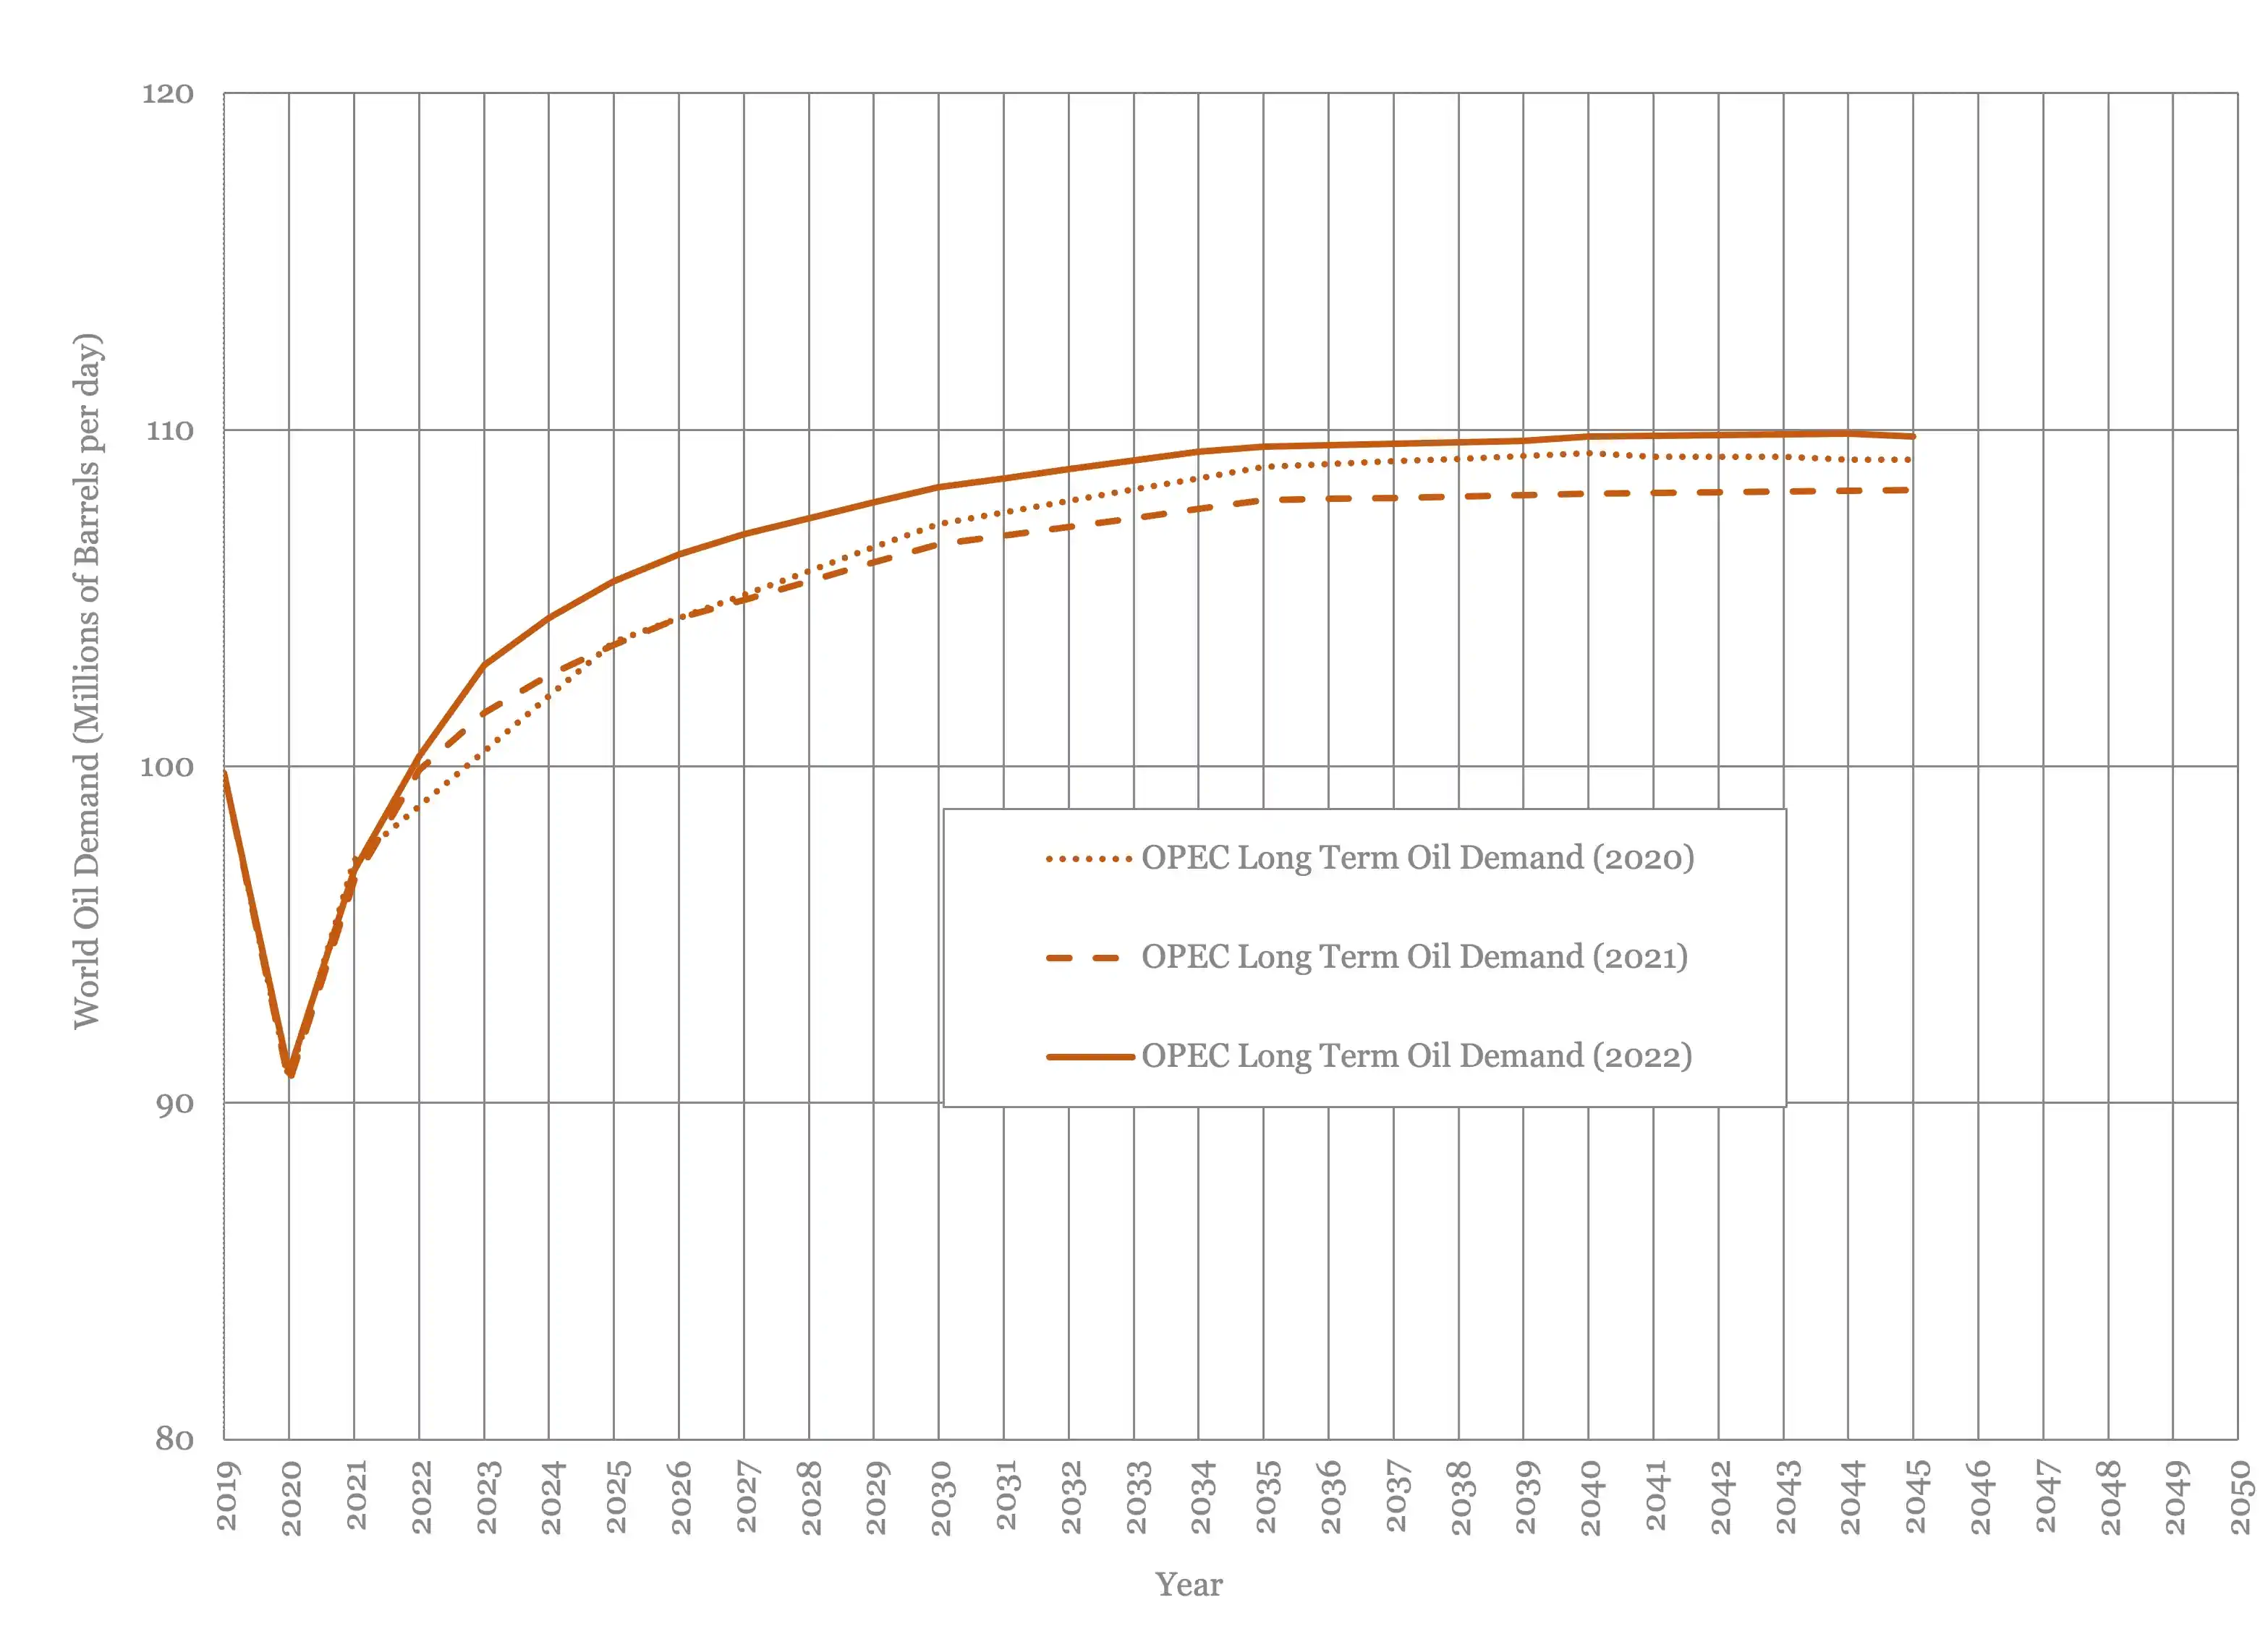
Figure 2 - OPEC Long Term Oil Demand Forecast
Figure 3 shows a comparison of this year’s IEA and OPEC demand forecasts, together with last year’s EIA forecast. OPEC is a little but more aggressive than the IEA, peaking at close to 109.8 MMbbl/day rather than 107.7 MMbbl/day, but the shape of the curves is similar. The EIA central forecast from 2021 remains the most optimistic for demand growth, at above 125 MMbbl/day by 2050, more than 25% above oil demand today.

Figure 3 - Long Term Oil Demand Comparison
Considering that industry suffers from underlying production declines of the order of 5%, the demand outlook for the next 30 years, which is around the lifecycle of a field development, looks quite positive.
Oil Supply and Demand
The IEA and EIA were generally more bullish than OPEC this month. The IEA (3) and EIA (4) raised their 2022 oil demand estimate by 300,000 bbl/day and 200,000 bbl/day respectively to 99.7 MMbbl/day and 99.8 MMbbl/day. OPEC (5) lowered theirs by 100,000 bbl/day to 99.6 MMbbl/day. As expected, oil demand forecasts are moving into a tight band as the year draws to a close.
The estimated oil demand spread for 2023 is wider, with the IEA and EIA holding steady at 101.3 MMbbl/day and 101 MMbbl/day respectively. OPEC downgraded their 2023 oil demand outlook by 200,000 bbl/day to 101.8 MMbbl/day.
On the supply side, OPEC+ have moved to bi-monthly meeting, so we should not expect a quota adjustment until December this year. We estimate supply this month will fall by nearly 1.2 MMbbl/day to 99.5 MMbbl/day as OPEC+’s revised quotas become effective. This moves the oil market from a slight surplus to a sharp deficit, with the outlook for it to remain tight for the rest of the forecast period.
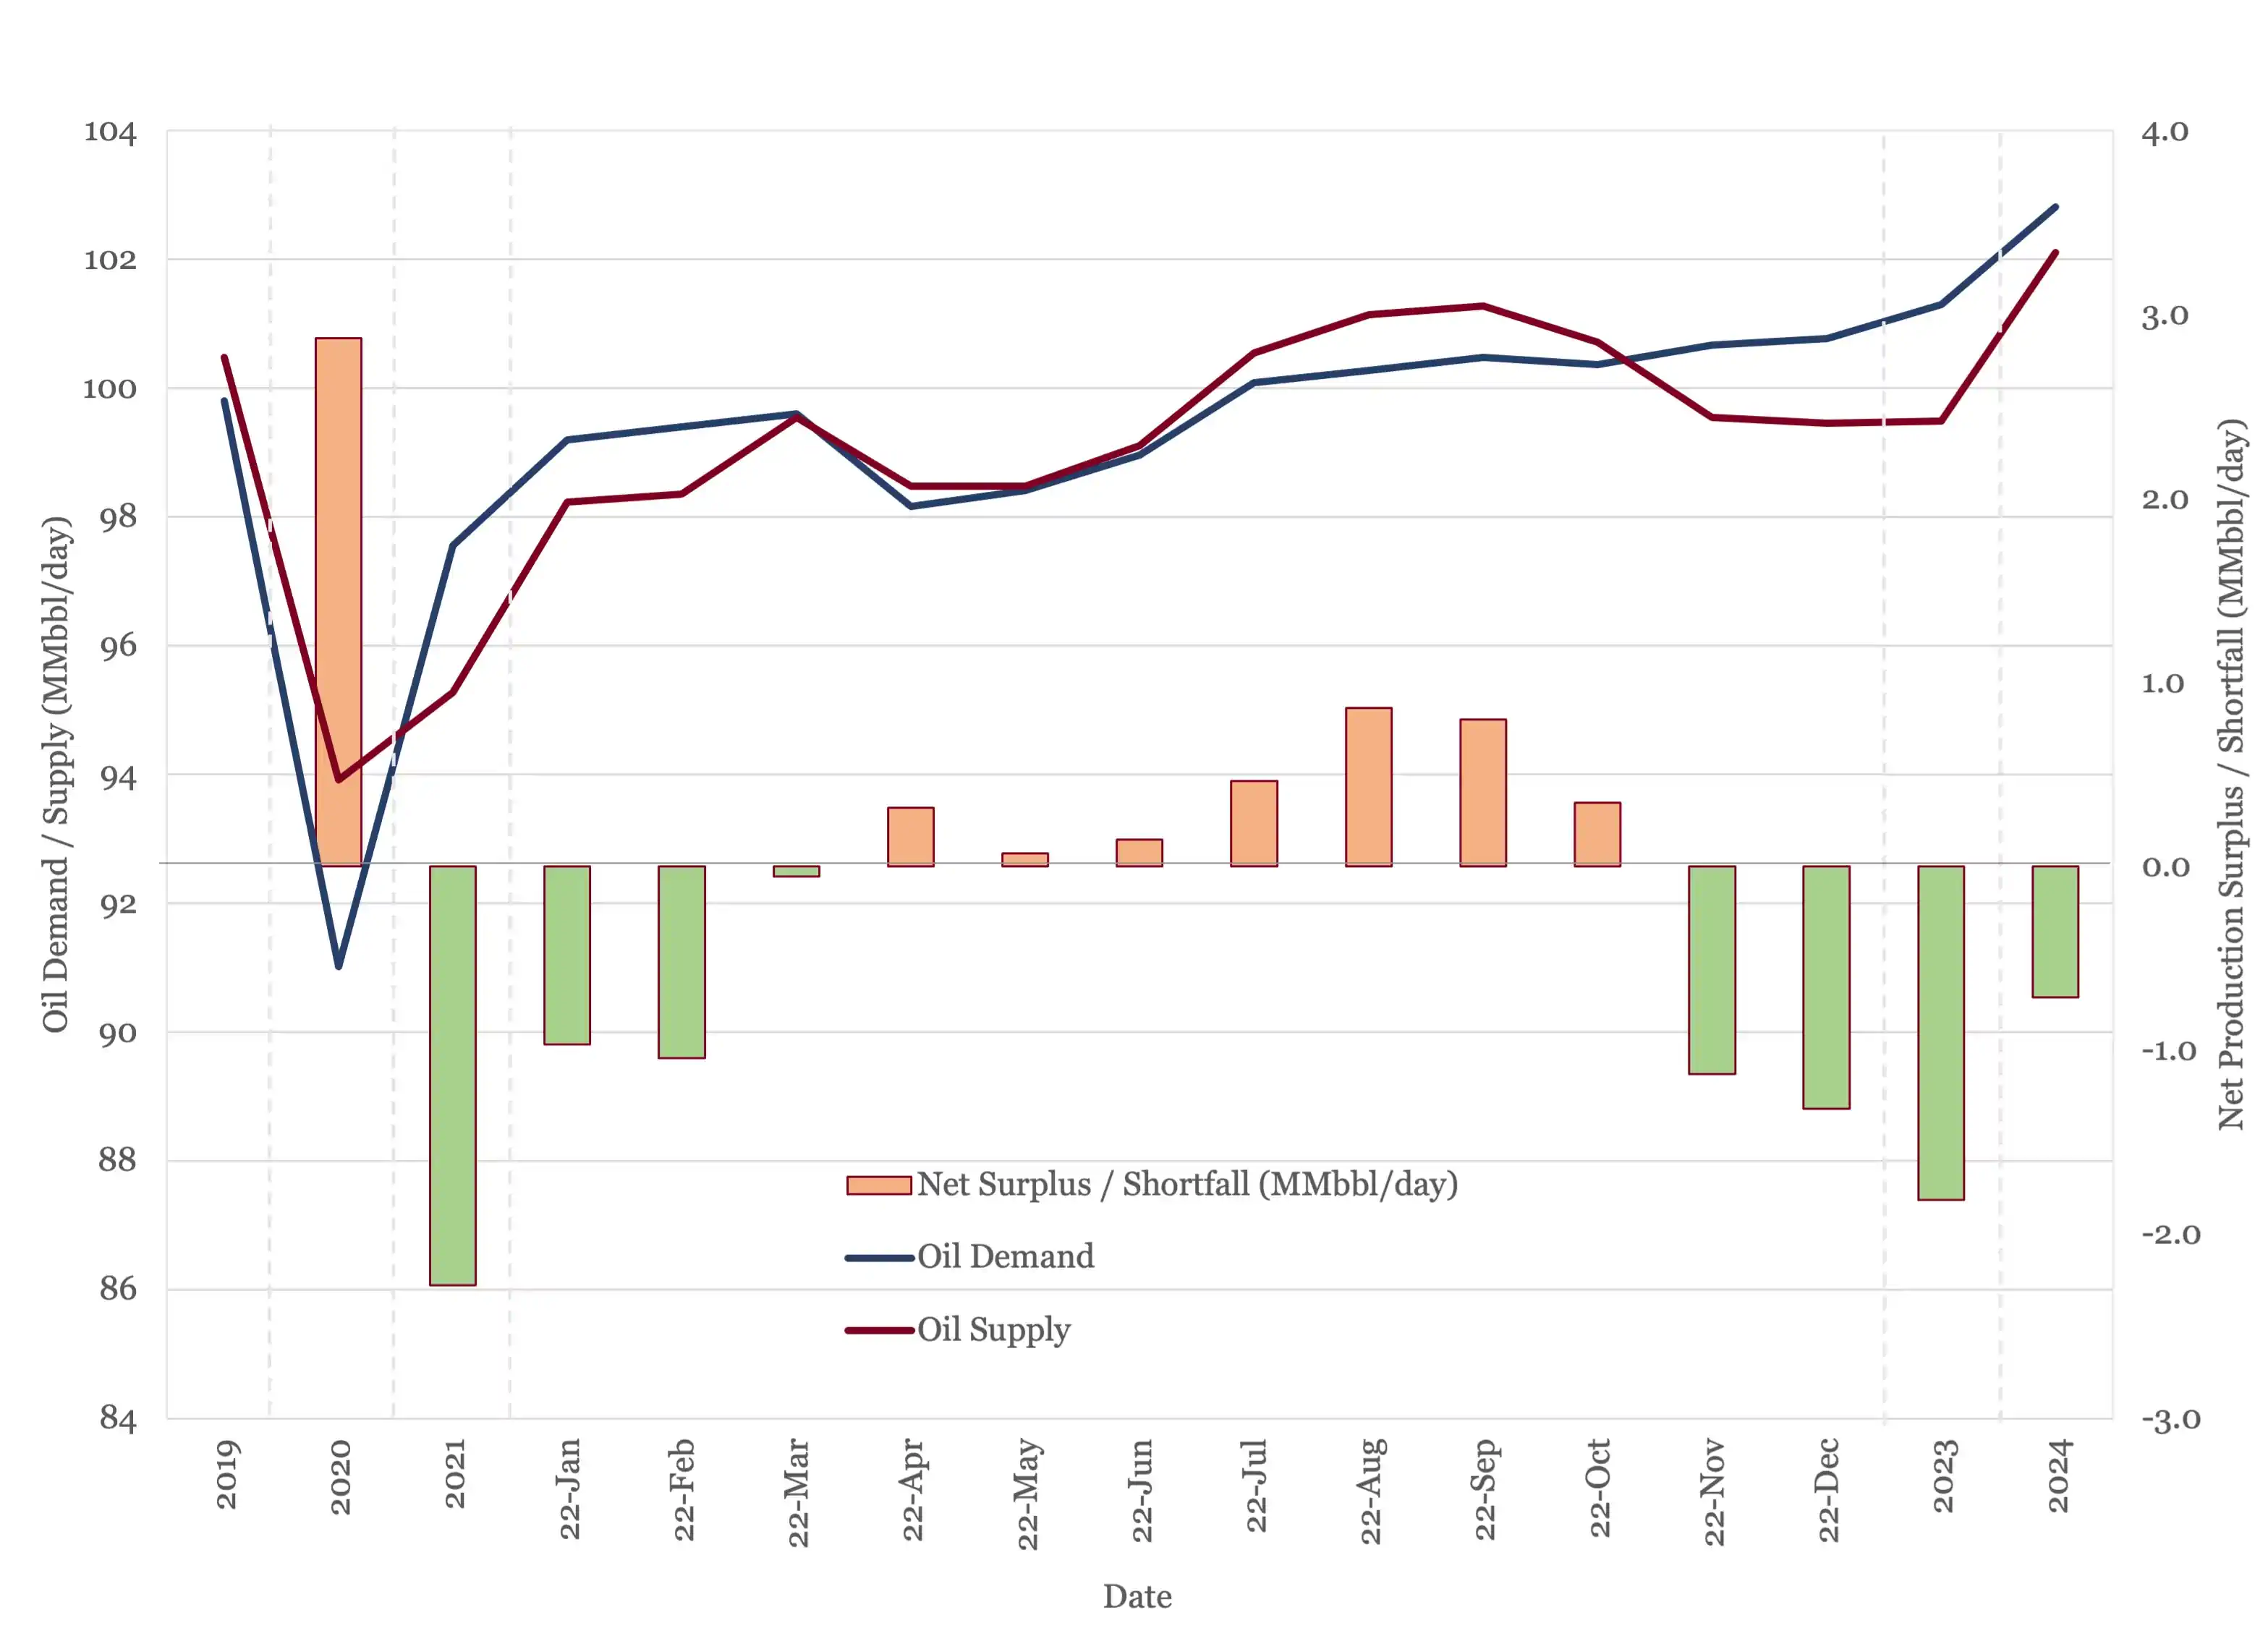
Figure 4 - Supply and Demand Forecast
Oil Storage
The recent round of OPEC+ production cuts have pushed what was a flat 2022 into a stock draw of 53 MMbbl. The picture next year, if the latest targets are maintained, is a much larger stock draw of 662 MMbbl, close to the kind of drawdown OPEC+ managed in 2021.

Figure 5 - Global Storage Chart
Oil Prices
After rising in late October, crude oil spot prices have drifted down to around $80/bbl WTI and $87/bbl Brent at the time or writing. Near term futures are down slightly this month but have risen further out on the maturity curve.
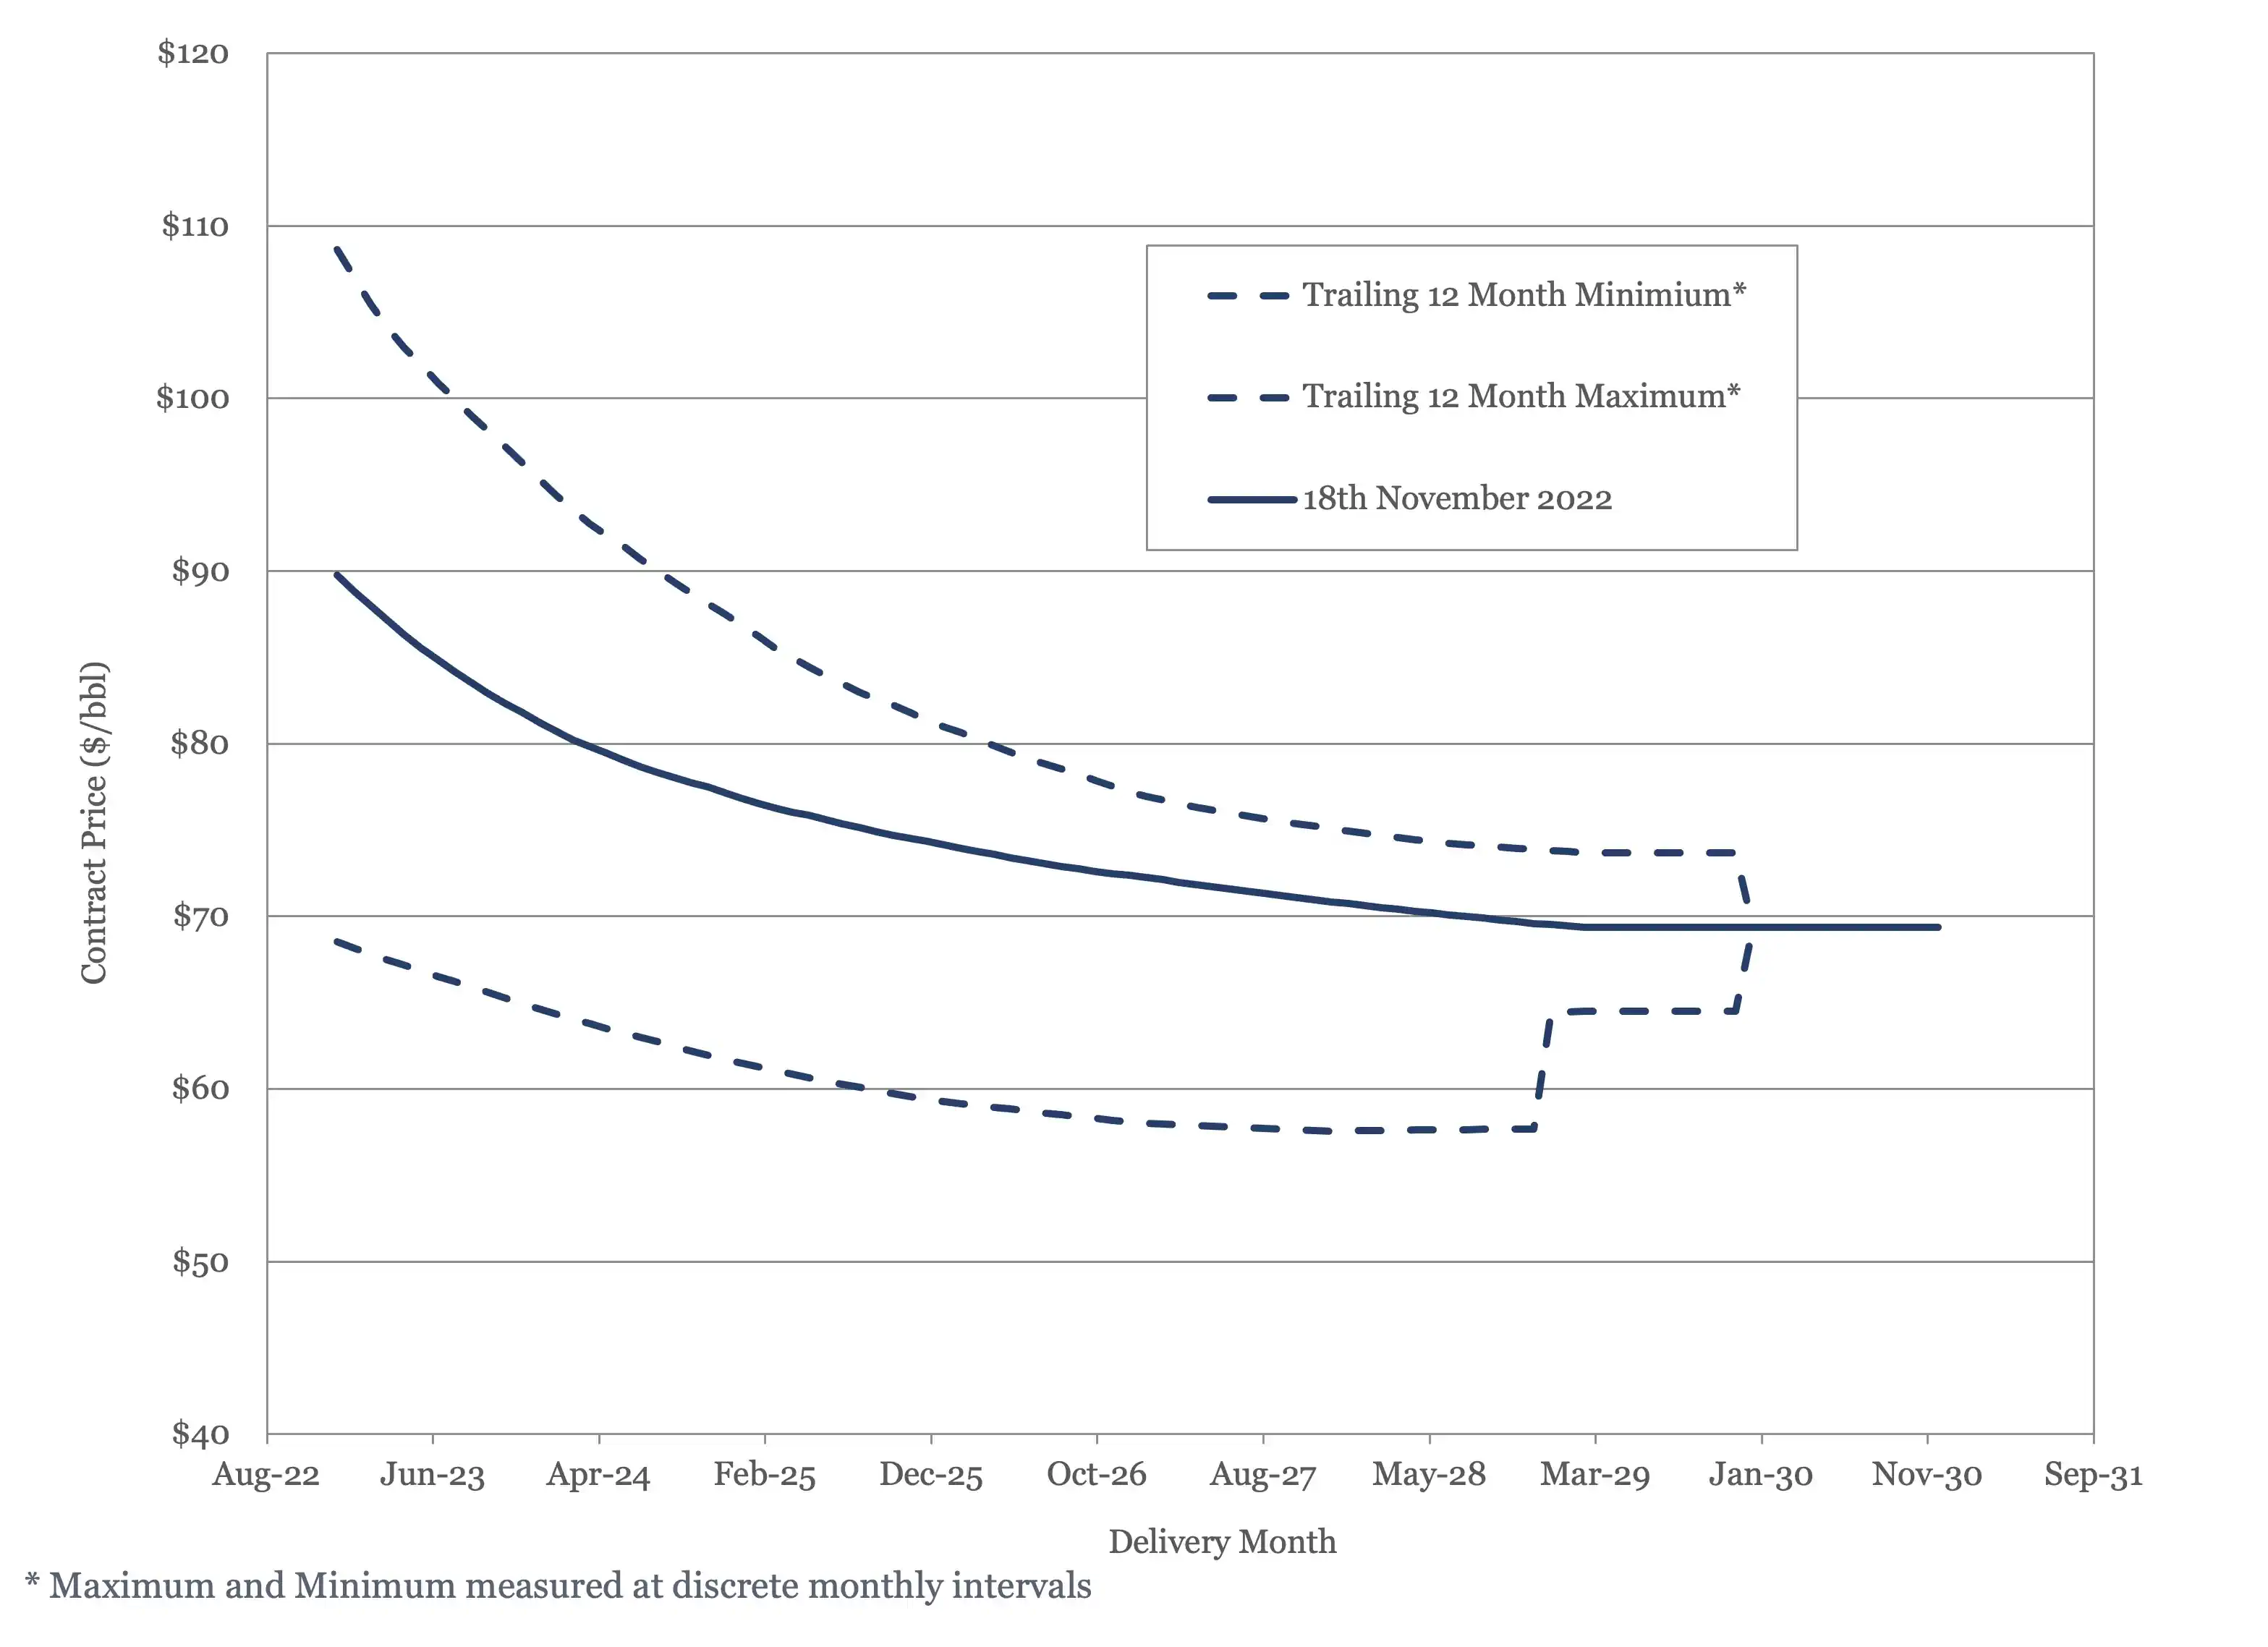
Figure 6 - Brent Crude Oil Futures
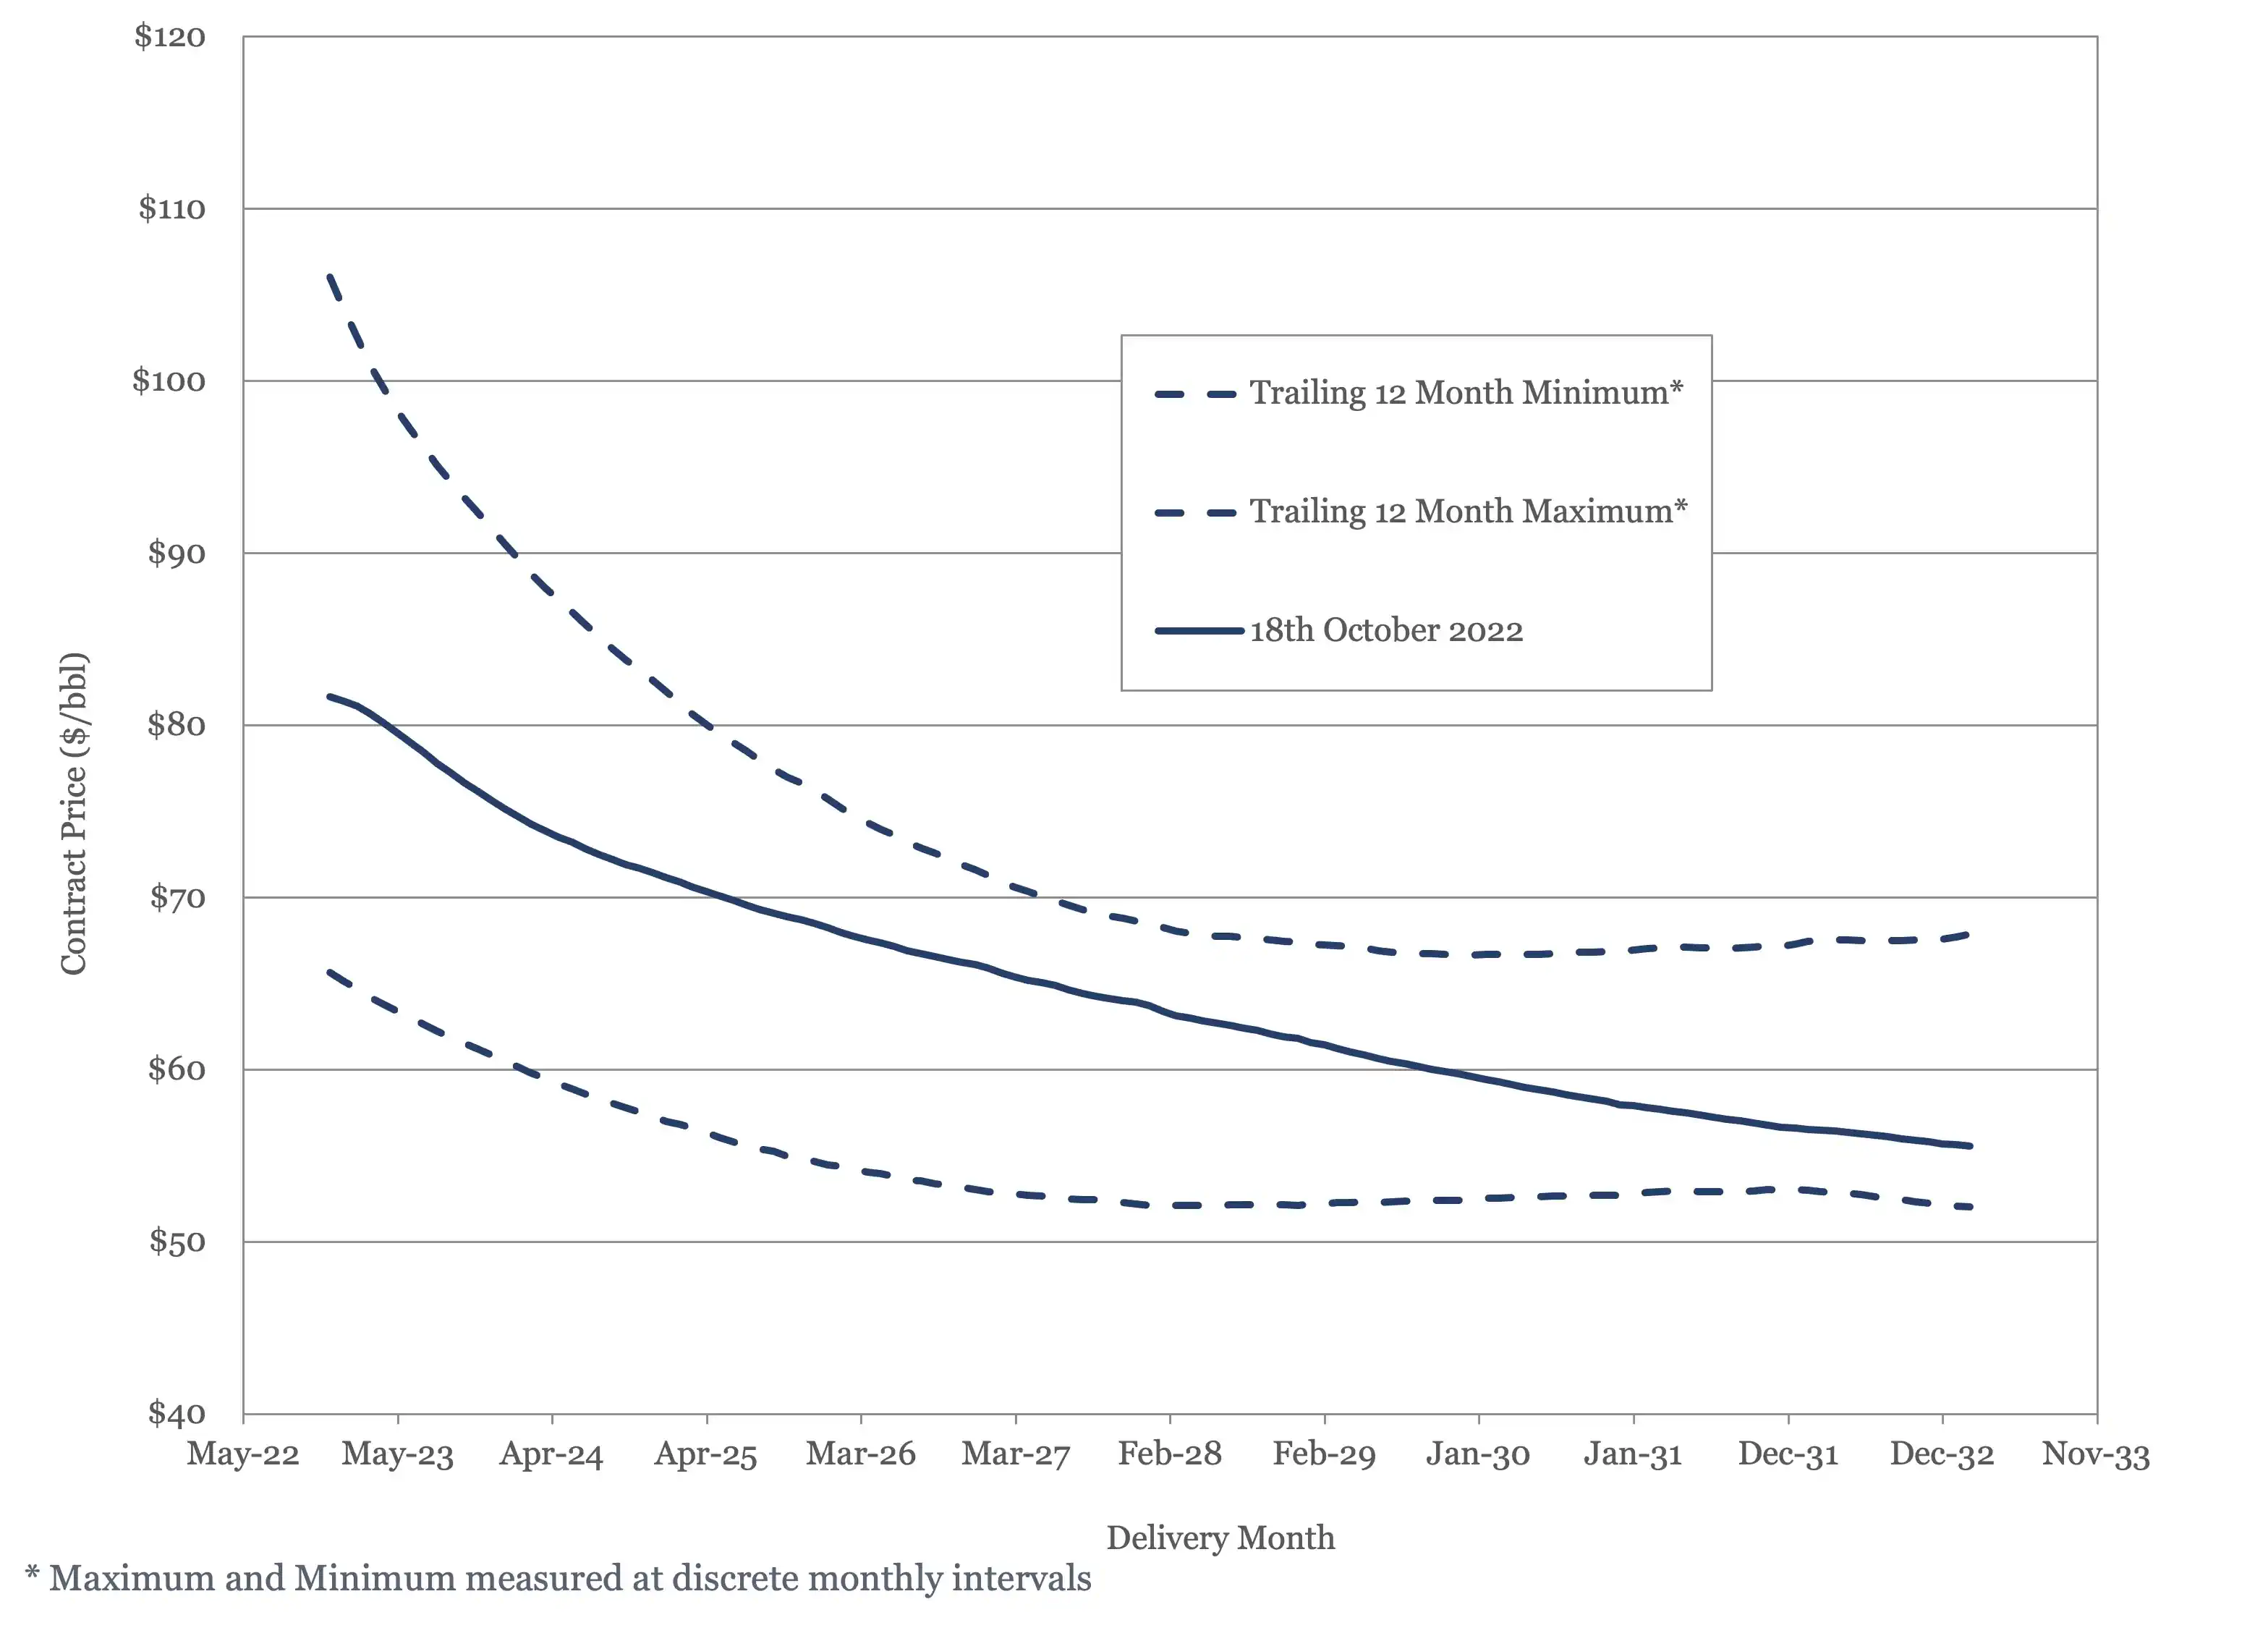
Figure 7 - WTI Oil Futures
US Activity
The US land oil rig count managed to break 600 this month, landing at 602 on November 18th. The rig count seems to have moved back onto an upward path, having seemed to have stalled over the summer.
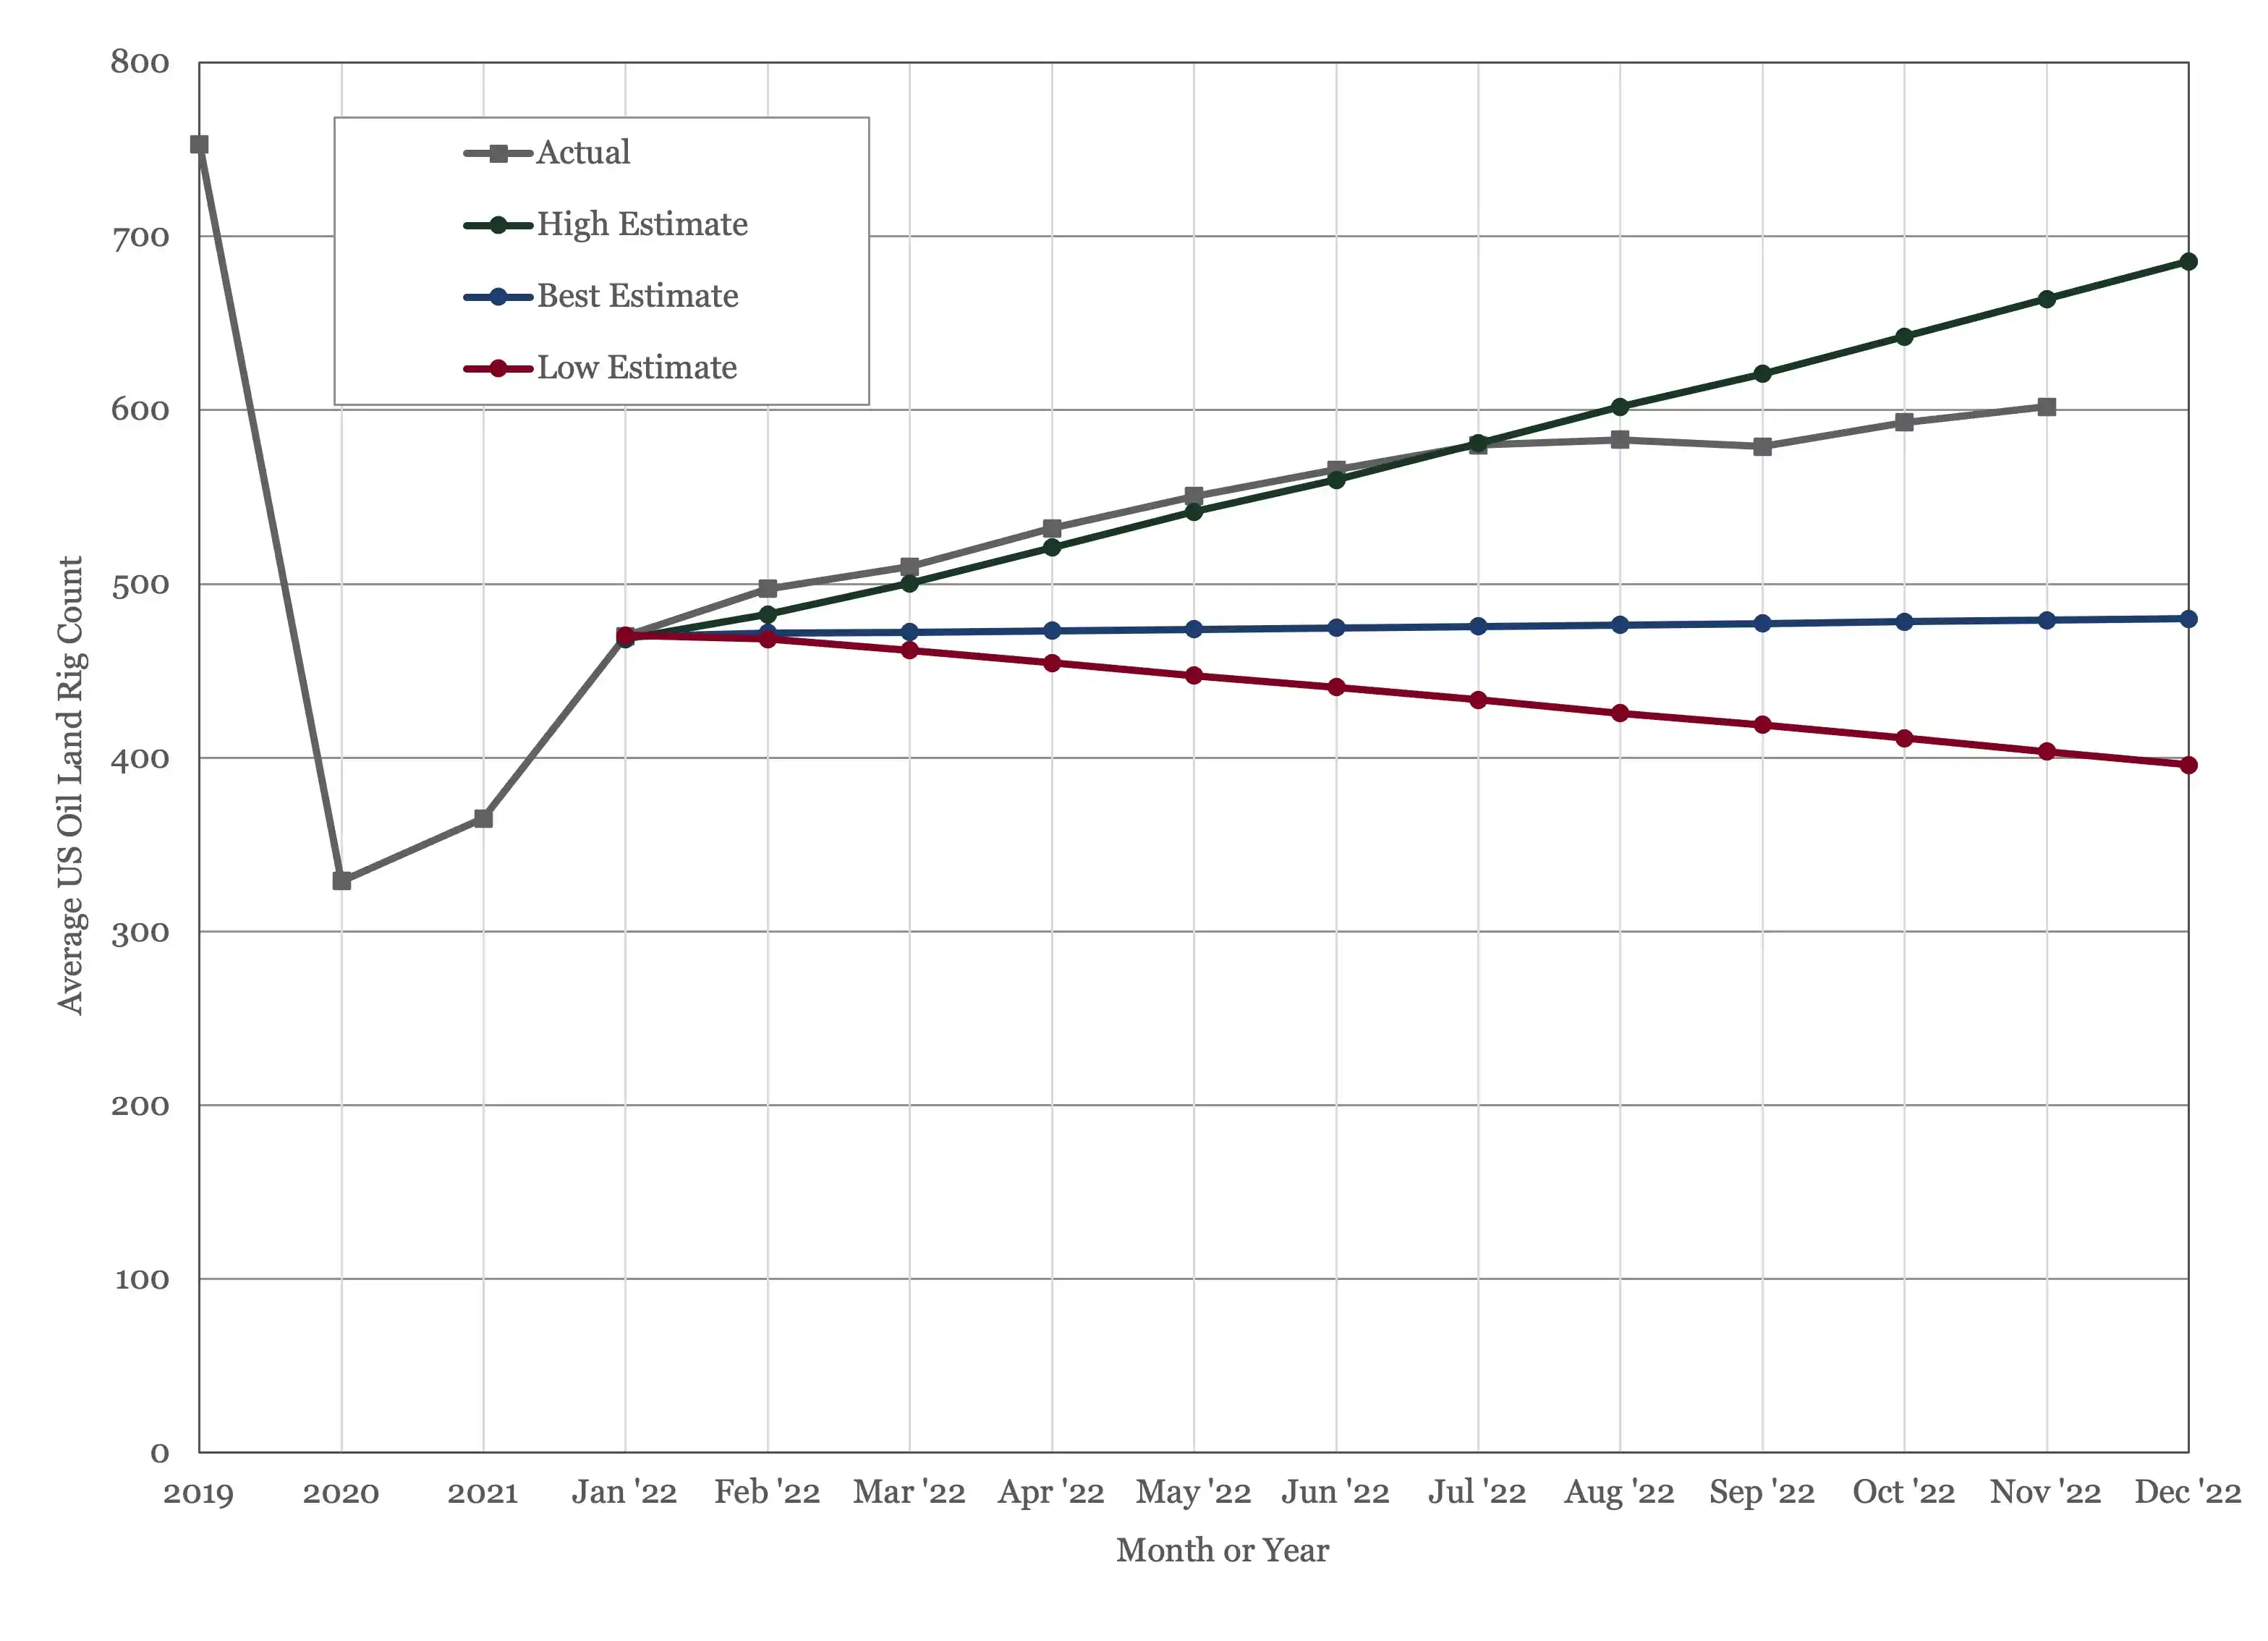
Figure 8 - US Land Oil Rig Count
(1) “World Energy Outlook 2022”, November 2022, IEA, Paris.
(2) “2022 World Oil Outlook 2045”, October 2022, Organization of the Petroleum Exporting Countries
(3) Oil Market Report – November 15th, 2022, IEA, Paris.
(4) Short Term Energy Outlook (STEO), November 3rd, 2022, U.S. Energy Information Administration.
(5) “OPEC Monthly Oil Market Report”, Organization of the Petroleum Exporting Countries, November14th, 2022.


Explore Our Services

Business Development
Oil & Gas an extractive industry, participants must continuously find and develop new oil & gas fields as existing fields decline, making business development a continuous process.

Strategy
We approach strategy through a scenario driven assessment of the client’s current portfolio, organizational competencies, and financial framework. The strategy defines portfolio actions and coveted asset attributes.
Origination
Deal origination consists of identifying coveted assets, assets with attributes consistent with the client’s strategy, and qualified buyers. We advocate a proactive approach to business development and will undertake outreach on our client’s behalf.

Transaction Support
Transaction support consists of in depth asset evaluation, negotiation of commercial agreements or preparation of license round submission and close out of conditions. We can also aid in joint venture set up and management and asset maturation as required.