Oil Market Forecast - October 2022
Summary
The economic outlook was downbeat last month, and it isn’t getting any better. As growth forecasts slump, so do oil demand forecasts and we certainly see that this month with demand estimates falling almost across the board. The bigger news, however, was on the supply side with OPEC+ announcing a major production cut. This is the area that we will focus on in this month’s oil market forecast, looking at how much of that reduction is real, and whether demand has weakened enough to justify it.
A few key points:
- The IEA, EIA and OPEC demand estimates for 2022 continue to converge with the range narrowing to between 99.4 MMbbl/day and 99.7 MMbbl/day.
- All three main reporting agencies cut their oil demand outlook for 2023 substantially, with OPEC cutting the most at 700,000 bbl/day.
- Oil stored in the US Strategic Petroleum Reserve (SPR) fell to its lowest level since 1984, with further sales authorized for November.
- OPEC+ imposed a target supply cut of 2 MMbbl/day, which we estimate is an effective cut of 1.32 MMbbl/day.
- Brent spot prices dipped and rose on SPR release and OPEC+ quota announcements but ended in the mid $80’s where they started.
- Both Brent and WTI futures contracts are down again this month.
- The US land oil rig count managed to break through 590, hitting 594 on the 14th of October.
- We downgraded our US oil production growth forecast for 2022 from 1.1 MMbbl/day to 900,000 MMbbl/day.
Oil Supply and Demand
Oil demand estimates for 2022 were mainly down this month. The IEA (1) and OPEC (2) lowered theirs by 60,000 bbl/day and 300,000bbl/day to 99.4 MMbbl/day and 99.7 MMbbl/day respectively, The EIA (3) raised theirs, by 100,000 bbl/day to 99.6 MMbbl/day. As we would expect, as the year draws to a close, these estimates are converging.
The estimated oil demand spread for 2023 is wider, but all the movement over the last month was in the same direction, with the only question being the extent of the downgrade. The IEA and EIA had similar outlooks, downgrading 2023 demand by 470,000 bbl/day and 500,000 bbl/day to 101.3 MMbbl/day and 101 MMbbl/day respectively. OPEC cut deeper, but from a higher starting point, lowering their 2023 demand estimate by 700,000 bbl/day to 102 MMbbl/day.
The outlook for demand growth certainly darkened over the last couple months, in line with projections for global economic growth. As we stand today, demand for 2022 will more or less match the oil demand record set in 2019. As we move into 2023, even these more muted demand growth estimates are around 2%, which is well above average growth by standards of the last 20 years. This suggests that there is still some COVID-19 rebound in there, as well as some additional demand from gas to oil switching for power generation.
The news over the last month was all on the supply side, with the Biden Administration announcing another release from the Strategic Petroleum Reserve (SPR), followed by an announcement by OPEC+ of a 2 MMbbl/day production cut (4). Taking the SPR release first, the US Department of Energy announced the sale of an additional 10 million barrels from the SPR in November. This garnered a lot of news coverage but didn’t have much impact on oil prices. As we have pointed out before, SPR releases are borrowing against future production, rather than introducing an additional supply of oil, and as the Wall Street Journal highlighted in a series of articles, the US Department of Energy has done a lot of borrowing against future production this year. In one article (5), they highlighted that SPR stocks have fallen to 427 MMbbl as of September 16th, the lowest level since 1984, when the reserve was still being filled after it was established in 1975.
The EIA estimated that the SPR has released around 155 MMbbl so far this year, with another 25 MMbbl still available for sale under the emergency authorization. It should be remembered that the SPR was created to provide the US with a buffer against scarcity, rather than to try and control oil prices, and there has been no scarcity in oil supplies this year. The buffer is wearing thin and should be replenished; reversing this year’s draws in 2023 would add about 0.5% to global oil demand. This policy has left the US vulnerable in the event of a genuine supply shock, with little to show in terms of benefit.
The second announcement over the last month was altogether more substantial. After 18 months of gradual production target increases, OPEC+ delivered a very large cut of 2 MMbbl/day in November and December, at least nominally. As we have been saying for a few months now, OPEC+ production targets have become increasingly symbolic as the gap between actual production and target production has grown. The latest data shows the shortfall against target production growing from 3.47 MMbbl/day in August to 3.55 MMbbl/day in September. As we have also pointed out before, however, this failure to hit output targets has been a blessing, as the market is currently balanced and an extra 3.5 MMbbl/day would flood it.
Given how far apart target and actual production have drifted, could the latest announcement be a way to bring the two back into alignment? There is certainly enough headroom to accommodate the 2 MMbbl/day cut in current production in the current supply shortfall. As Figure 1 shows, however, that is not how the cuts fell. They were spread more equally, resulting in a real drop in production of 1.32 MMbbl/day. This does not look like an account reconciliation exercise, rather it looks like a real cut in production.
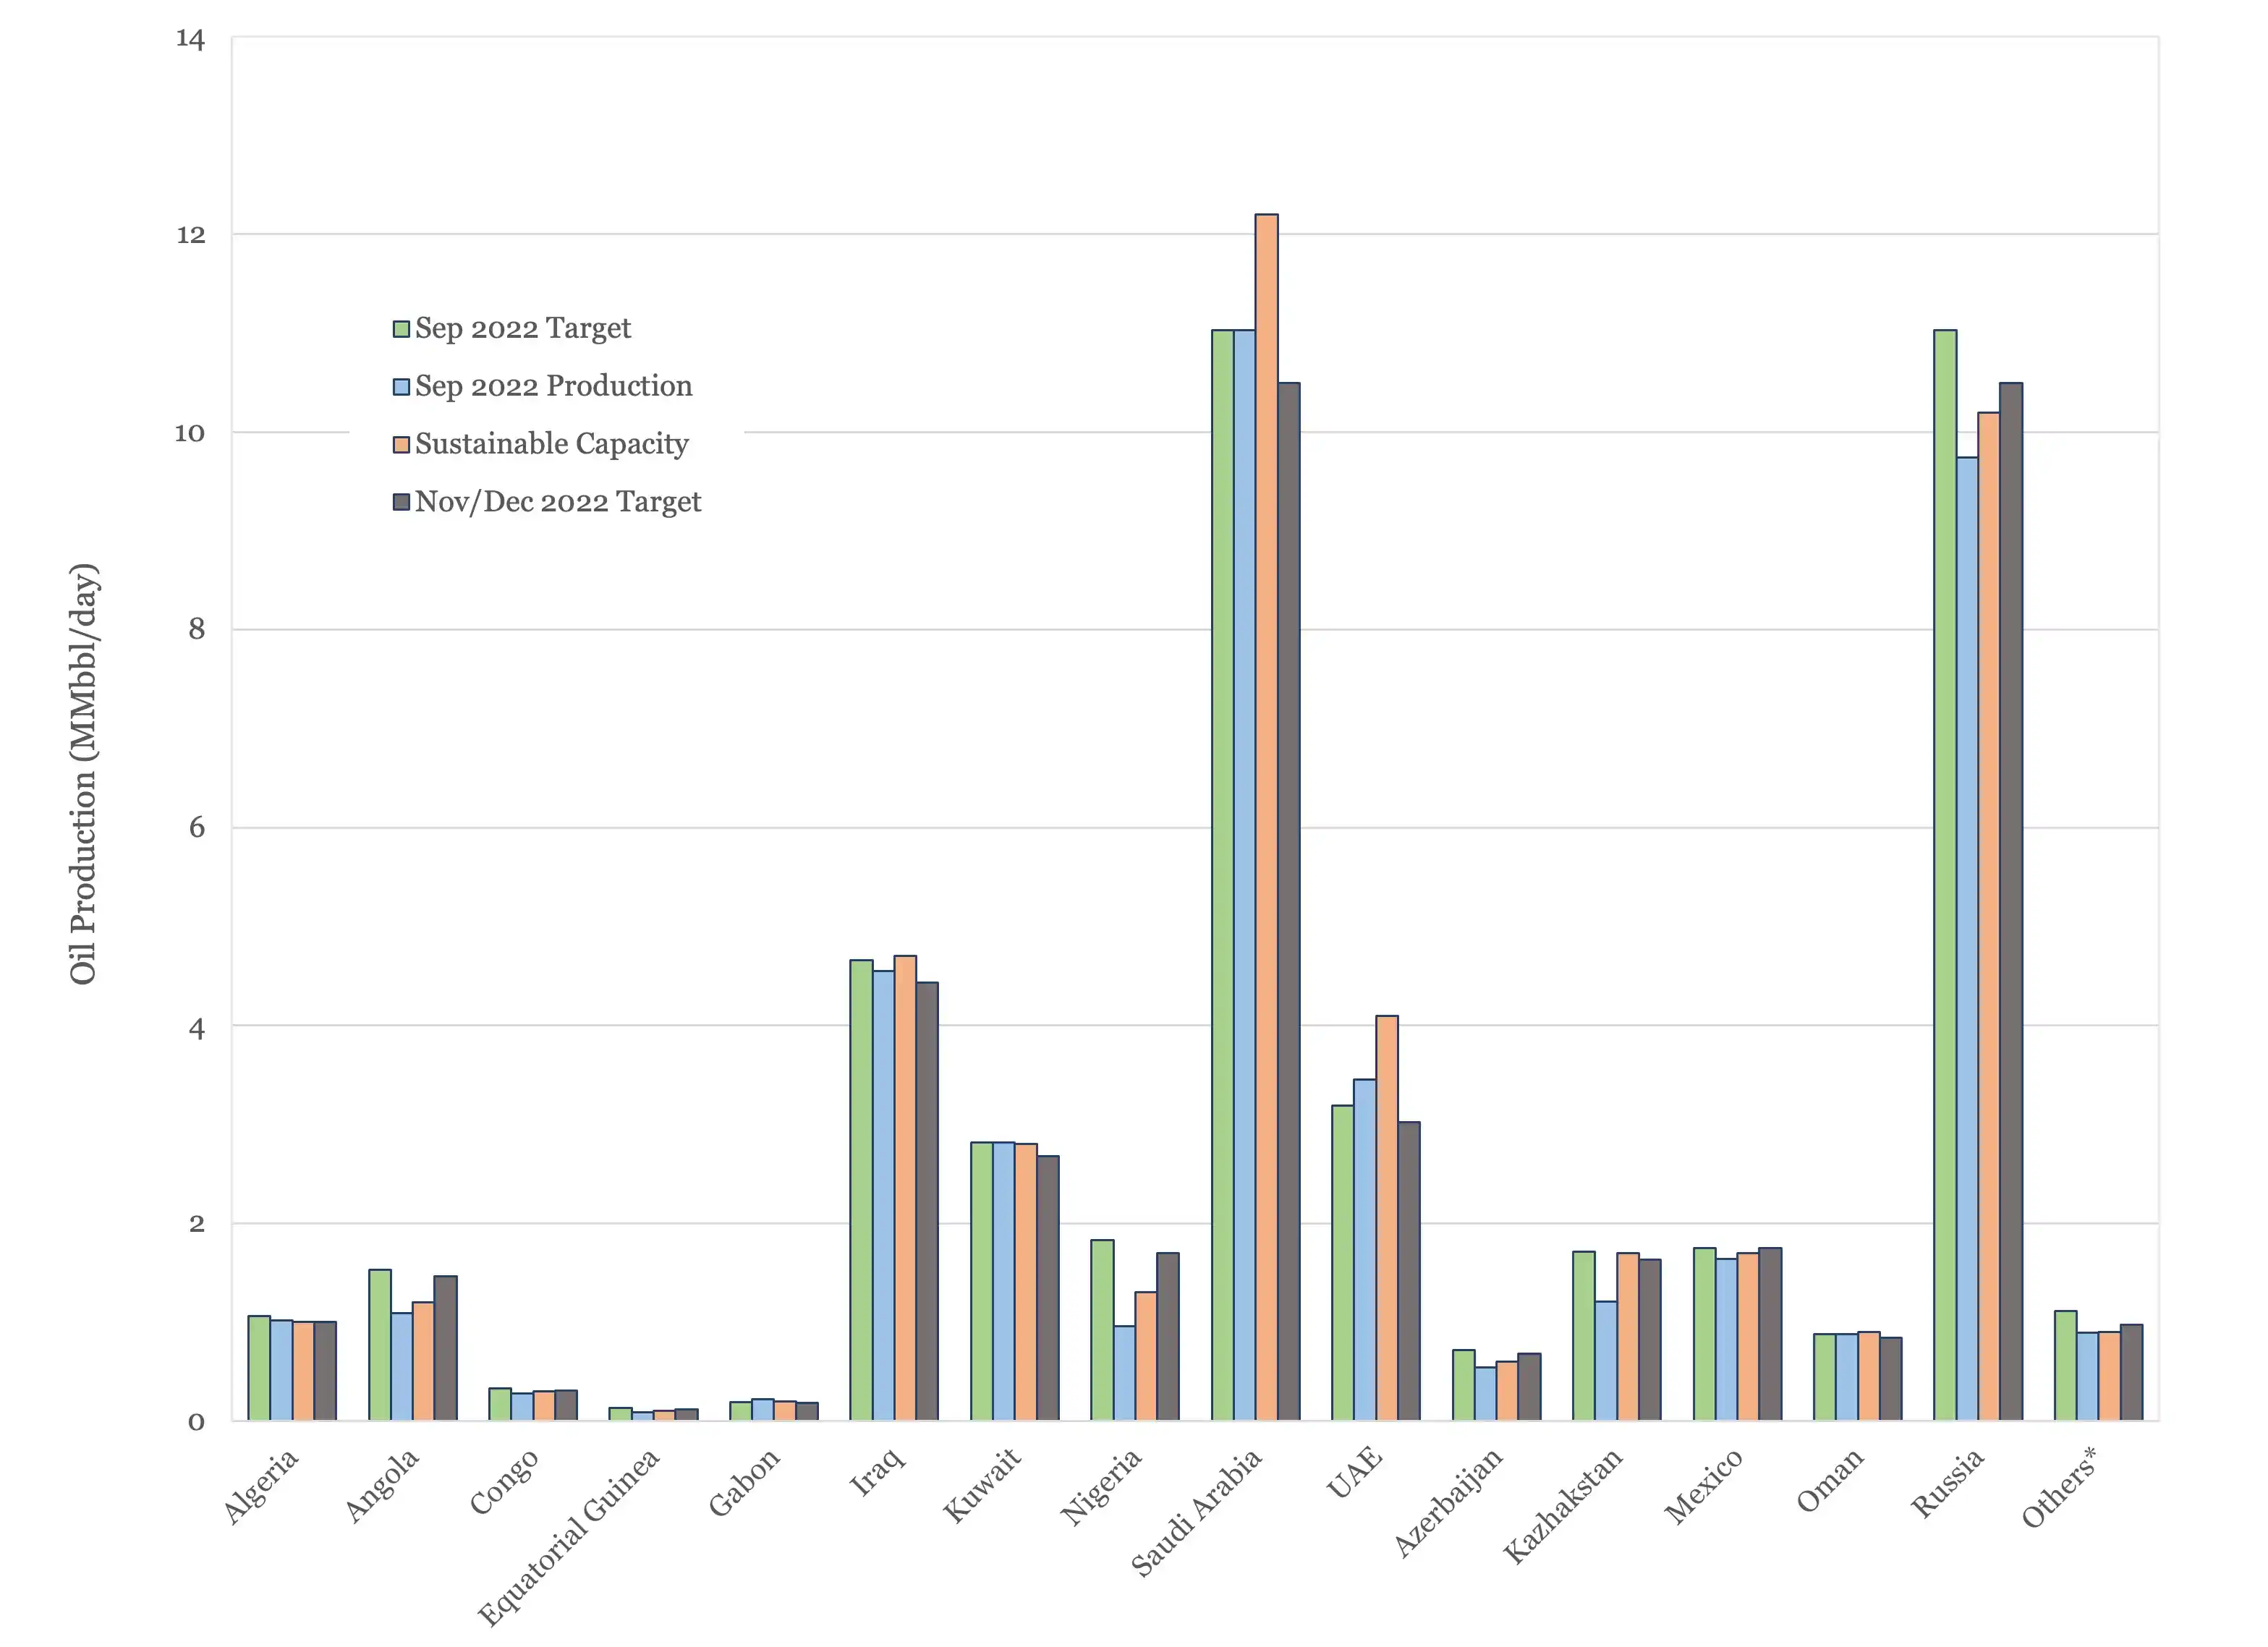
Figure 1 - Oil Production and Oil Production Capacity against Target
*Others are Bahrain, Brunei, Malaysia, Sudan and South Sudan
Does that mean that the market was oversupplied, given recent demand downgrades? Figure 2, below, shows the oil market balance between prior to the OPEC+ cut. As Figure 2 shows, prior to the OPEC+ cuts, the oil market was predicted to be in modest deficit through Q4 and into 2023 and 2024.

Figure 2 - Supply and Demand Surplus Forecast Prior to OPEC+ Production Cut
One of the key sensitivities in here is the assumption around Russian production next year, when the EU restrictions on trade and the EU / US Russian oil price cap is introduced (see last month’s Oil Market Forecast). We are assuming that Russian exports will average 9.7 MMbbl/day next year, but clearly oil market balance will be very sensitive to that figure. OPEC+ may be anticipating further falls in demand, or they may have factored in less of an impact from next year’s Russian sanctions. However, neither of those would provide a justification for introducing a supply cut now. OPEC+ have moved from monthly to bi-monthly meetings, so they will not meet again until December, and the next round of production targets will cover January and perhaps February 2023. Even considering this, global oil storage is below the 5-year average and demand is predicted to outstrip supply for this last quarter.
Having eliminated reconciliation of production targets with production, and concerns about oversupply, we are left to conclude that the production cut was probably undertaken to support oil prices; a strange thing to do in a tight market with an economy heading into recession. As discussed in the Oil Price section, any impact appears to have been short-lived. With the OPEC+ production cuts in place, and assuming that they are extended through 2023, the market looks very tight indeed, as shown in Figure 3.
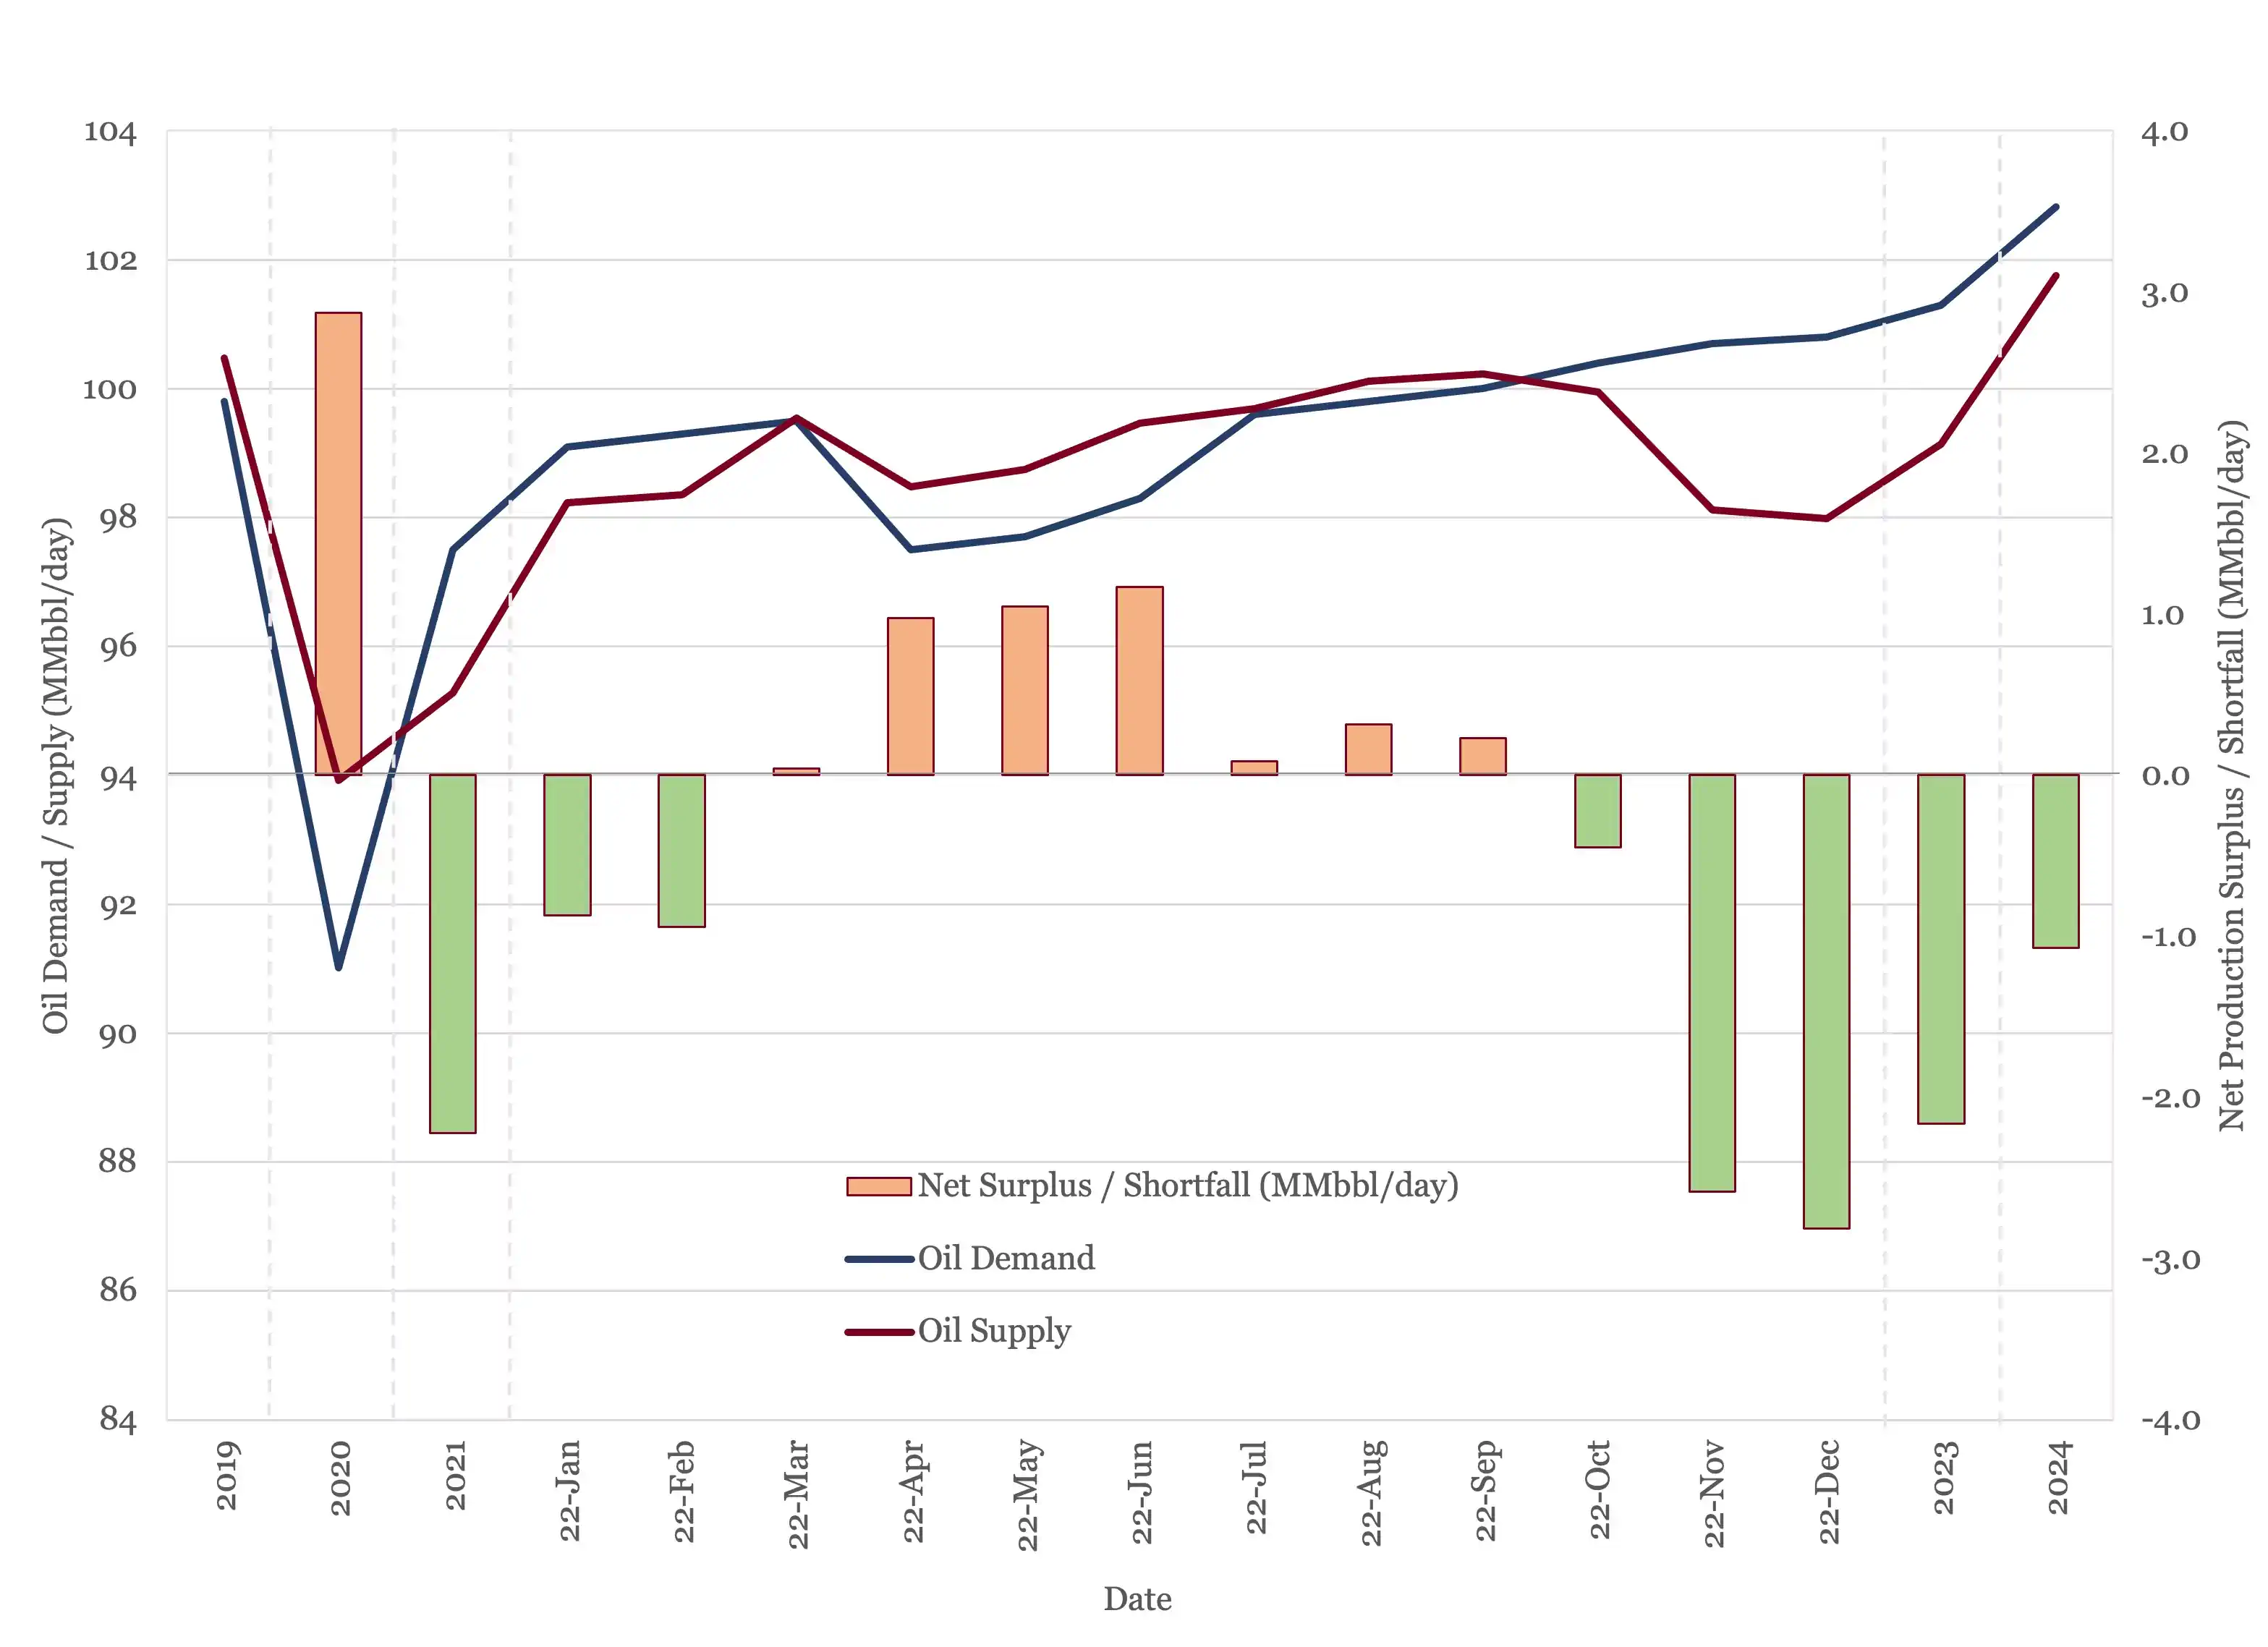
Figure 3 - Supply and Demand Surplus Forecast
Oil Storage
The recent round of OPEC+ production cuts have pushed what was a flat 2022 into a stock draw of 118 MMbbl. The picture next year, if the latest targets are maintained, is a much larger stock draw of 789 MMbbl, close to the kind of drawdown OPEC+ managed in 2021. Based on this outlook, next year does not look like an opportune time to restock the SPR.

Figure 4 - Global Storage Chart
Oil Prices
Crude oil prices have moved up and down over the last month but ended where they started with Brent sitting at $85/bbl. There was a dip into the $70s after the SPR release announcement on the 19th of September, but prices had already climbed back above $80/bbl before the OPEC+ cut was announced on the 5th of October. Brent jumped briefly above $90/bbl but fell back quickly into the $80s.
Both Brent and WTI futures slipped this month, especially for contracts in the second half of the decade. Brent now dips under $70 in 2026, with WTI passing the same threshold in 2025.

Figure 5 - Brent Crude Oil Futures
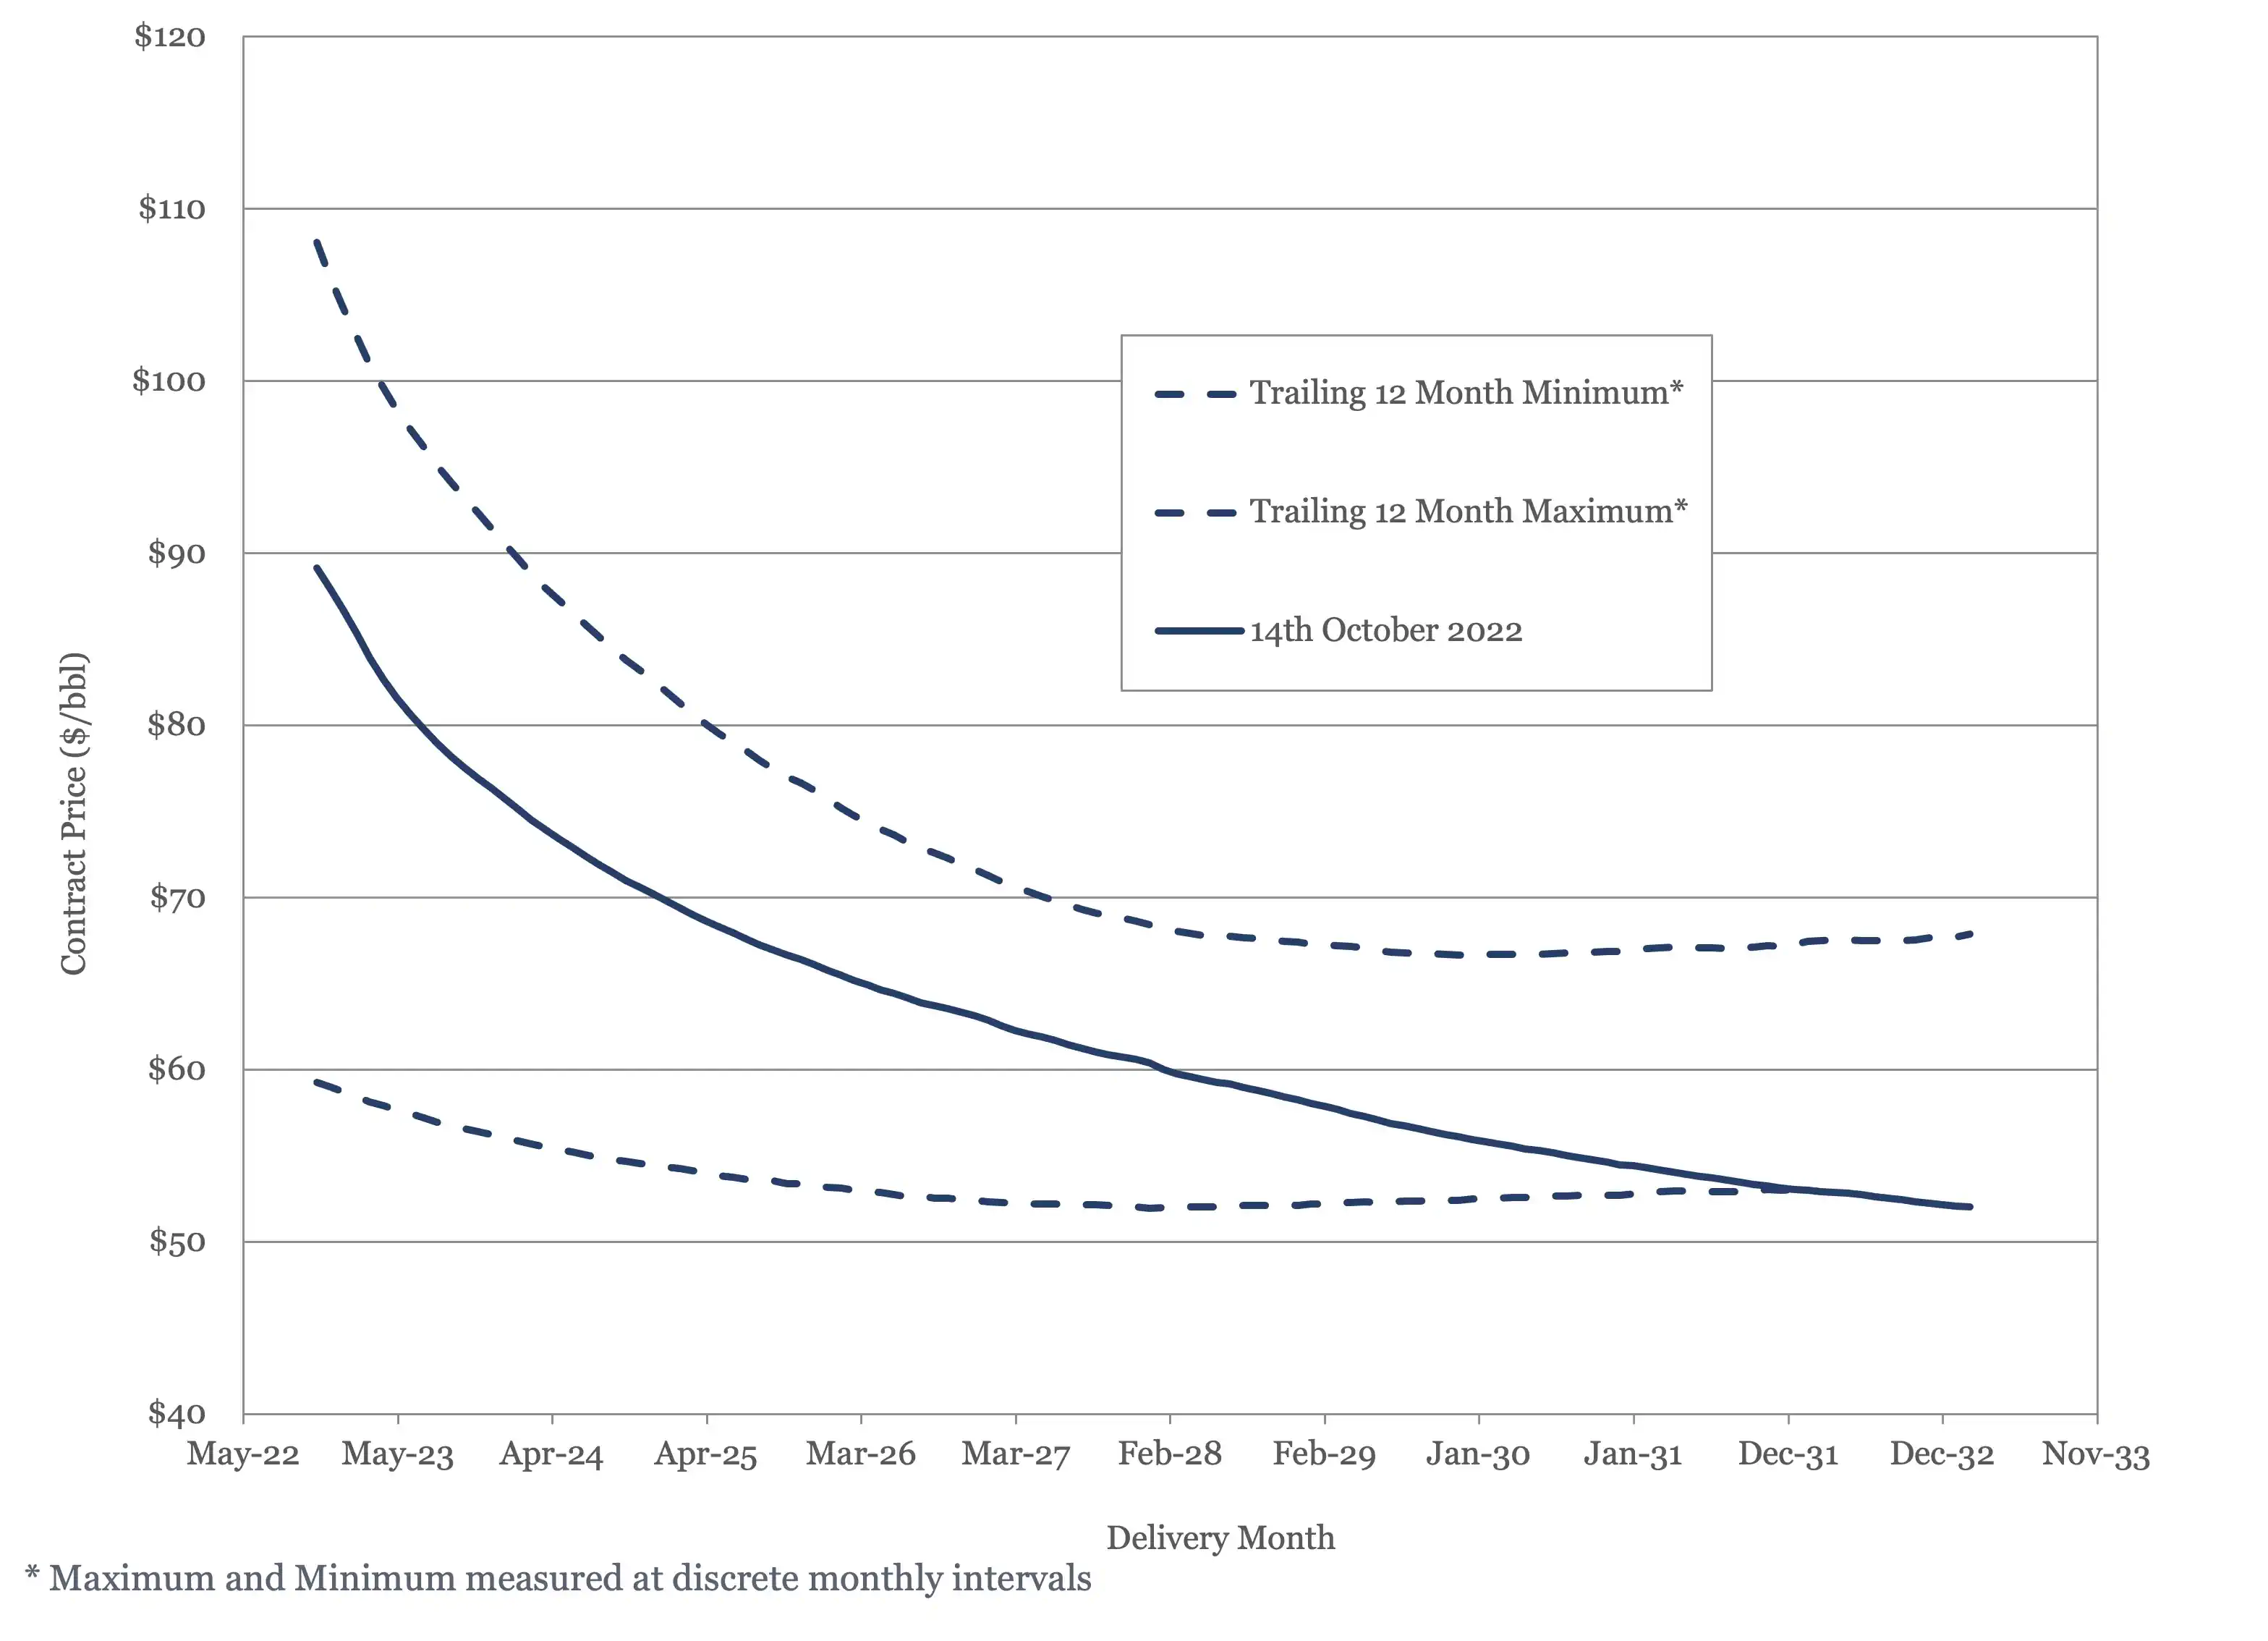
Figure 6 - WTI Crude Oil Futures
US Activity
The US land oil rig count did hit a new high at 594 last week, but generally growth does seem to have leveled off. Consequently, we have cut our estimate for US supply growth from 1.1 MMbbl/day to 900,000 bbl/day this year.

Figure 7 - US Land Oil Rig Count
(1) Oil Market Report – October 13th, 2022, IEA, Paris.
(2) “OPEC Monthly Oil Market Report”, Organization of the Petroleum Exporting Countries, October 12th, 2022.
(3) Short Term Energy Outlook (STEO), October 6th, 2022, U.S. Energy Information Administration.
(4) 33rd OPEC and non-OPEC Ministerial Meeting, October 5th, 2022.
(5) "America Has Lost Its Oil Buffer", Jingo Lee, The Wall Street Journal, September 22nd 2022.


Oil Market Forecast - October 2022
Summary
The economic outlook was downbeat last month, and it isn’t getting any better. As growth forecasts slump, so do oil demand forecasts and we certainly see that this month with demand estimates falling almost across the board. The bigger news, however, was on the supply side with OPEC+ announcing a major production cut. This is the area that we will focus on in this month’s oil market forecast, looking at how much of that reduction is real, and whether demand has weakened enough to justify it.
A few key points:
- The IEA, EIA and OPEC demand estimates for 2022 continue to converge with the range narrowing to between 99.4 MMbbl/day and 99.7 MMbbl/day.
- All three main reporting agencies cut their oil demand outlook for 2023 substantially, with OPEC cutting the most at 700,000 bbl/day.
- Oil stored in the US Strategic Petroleum Reserve (SPR) fell to its lowest level since 1984, with further sales authorized for November.
- OPEC+ imposed a target supply cut of 2 MMbbl/day, which we estimate is an effective cut of 1.32 MMbbl/day.
- Brent spot prices dipped and rose on SPR release and OPEC+ quota announcements but ended in the mid $80’s where they started.
- Both Brent and WTI futures contracts are down again this month.
- The US land oil rig count managed to break through 590, hitting 594 on the 14th of October.
- We downgraded our US oil production growth forecast for 2022 from 1.1 MMbbl/day to 900,000 MMbbl/day.
Oil Supply and Demand
Oil demand estimates for 2022 were mainly down this month. The IEA (1) and OPEC (2) lowered theirs by 60,000 bbl/day and 300,000bbl/day to 99.4 MMbbl/day and 99.7 MMbbl/day respectively, The EIA (3) raised theirs, by 100,000 bbl/day to 99.6 MMbbl/day. As we would expect, as the year draws to a close, these estimates are converging.
The estimated oil demand spread for 2023 is wider, but all the movement over the last month was in the same direction, with the only question being the extent of the downgrade. The IEA and EIA had similar outlooks, downgrading 2023 demand by 470,000 bbl/day and 500,000 bbl/day to 101.3 MMbbl/day and 101 MMbbl/day respectively. OPEC cut deeper, but from a higher starting point, lowering their 2023 demand estimate by 700,000 bbl/day to 102 MMbbl/day.
The outlook for demand growth certainly darkened over the last couple months, in line with projections for global economic growth. As we stand today, demand for 2022 will more or less match the oil demand record set in 2019. As we move into 2023, even these more muted demand growth estimates are around 2%, which is well above average growth by standards of the last 20 years. This suggests that there is still some COVID-19 rebound in there, as well as some additional demand from gas to oil switching for power generation.
The news over the last month was all on the supply side, with the Biden Administration announcing another release from the Strategic Petroleum Reserve (SPR), followed by an announcement by OPEC+ of a 2 MMbbl/day production cut (4). Taking the SPR release first, the US Department of Energy announced the sale of an additional 10 million barrels from the SPR in November. This garnered a lot of news coverage but didn’t have much impact on oil prices. As we have pointed out before, SPR releases are borrowing against future production, rather than introducing an additional supply of oil, and as the Wall Street Journal highlighted in a series of articles, the US Department of Energy has done a lot of borrowing against future production this year. In one article (5), they highlighted that SPR stocks have fallen to 427 MMbbl as of September 16th, the lowest level since 1984, when the reserve was still being filled after it was established in 1975.
The EIA estimated that the SPR has released around 155 MMbbl so far this year, with another 25 MMbbl still available for sale under the emergency authorization. It should be remembered that the SPR was created to provide the US with a buffer against scarcity, rather than to try and control oil prices, and there has been no scarcity in oil supplies this year. The buffer is wearing thin and should be replenished; reversing this year’s draws in 2023 would add about 0.5% to global oil demand. This policy has left the US vulnerable in the event of a genuine supply shock, with little to show in terms of benefit.
The second announcement over the last month was altogether more substantial. After 18 months of gradual production target increases, OPEC+ delivered a very large cut of 2 MMbbl/day in November and December, at least nominally. As we have been saying for a few months now, OPEC+ production targets have become increasingly symbolic as the gap between actual production and target production has grown. The latest data shows the shortfall against target production growing from 3.47 MMbbl/day in August to 3.55 MMbbl/day in September. As we have also pointed out before, however, this failure to hit output targets has been a blessing, as the market is currently balanced and an extra 3.5 MMbbl/day would flood it.
Given how far apart target and actual production have drifted, could the latest announcement be a way to bring the two back into alignment? There is certainly enough headroom to accommodate the 2 MMbbl/day cut in current production in the current supply shortfall. As Figure 1 shows, however, that is not how the cuts fell. They were spread more equally, resulting in a real drop in production of 1.32 MMbbl/day. This does not look like an account reconciliation exercise, rather it looks like a real cut in production.

Figure 1 - Oil Production and Oil Production Capacity against Target
*Others are Bahrain, Brunei, Malaysia, Sudan and South Sudan
Does that mean that the market was oversupplied, given recent demand downgrades? Figure 2, below, shows the oil market balance between prior to the OPEC+ cut. As Figure 2 shows, prior to the OPEC+ cuts, the oil market was predicted to be in modest deficit through Q4 and into 2023 and 2024.
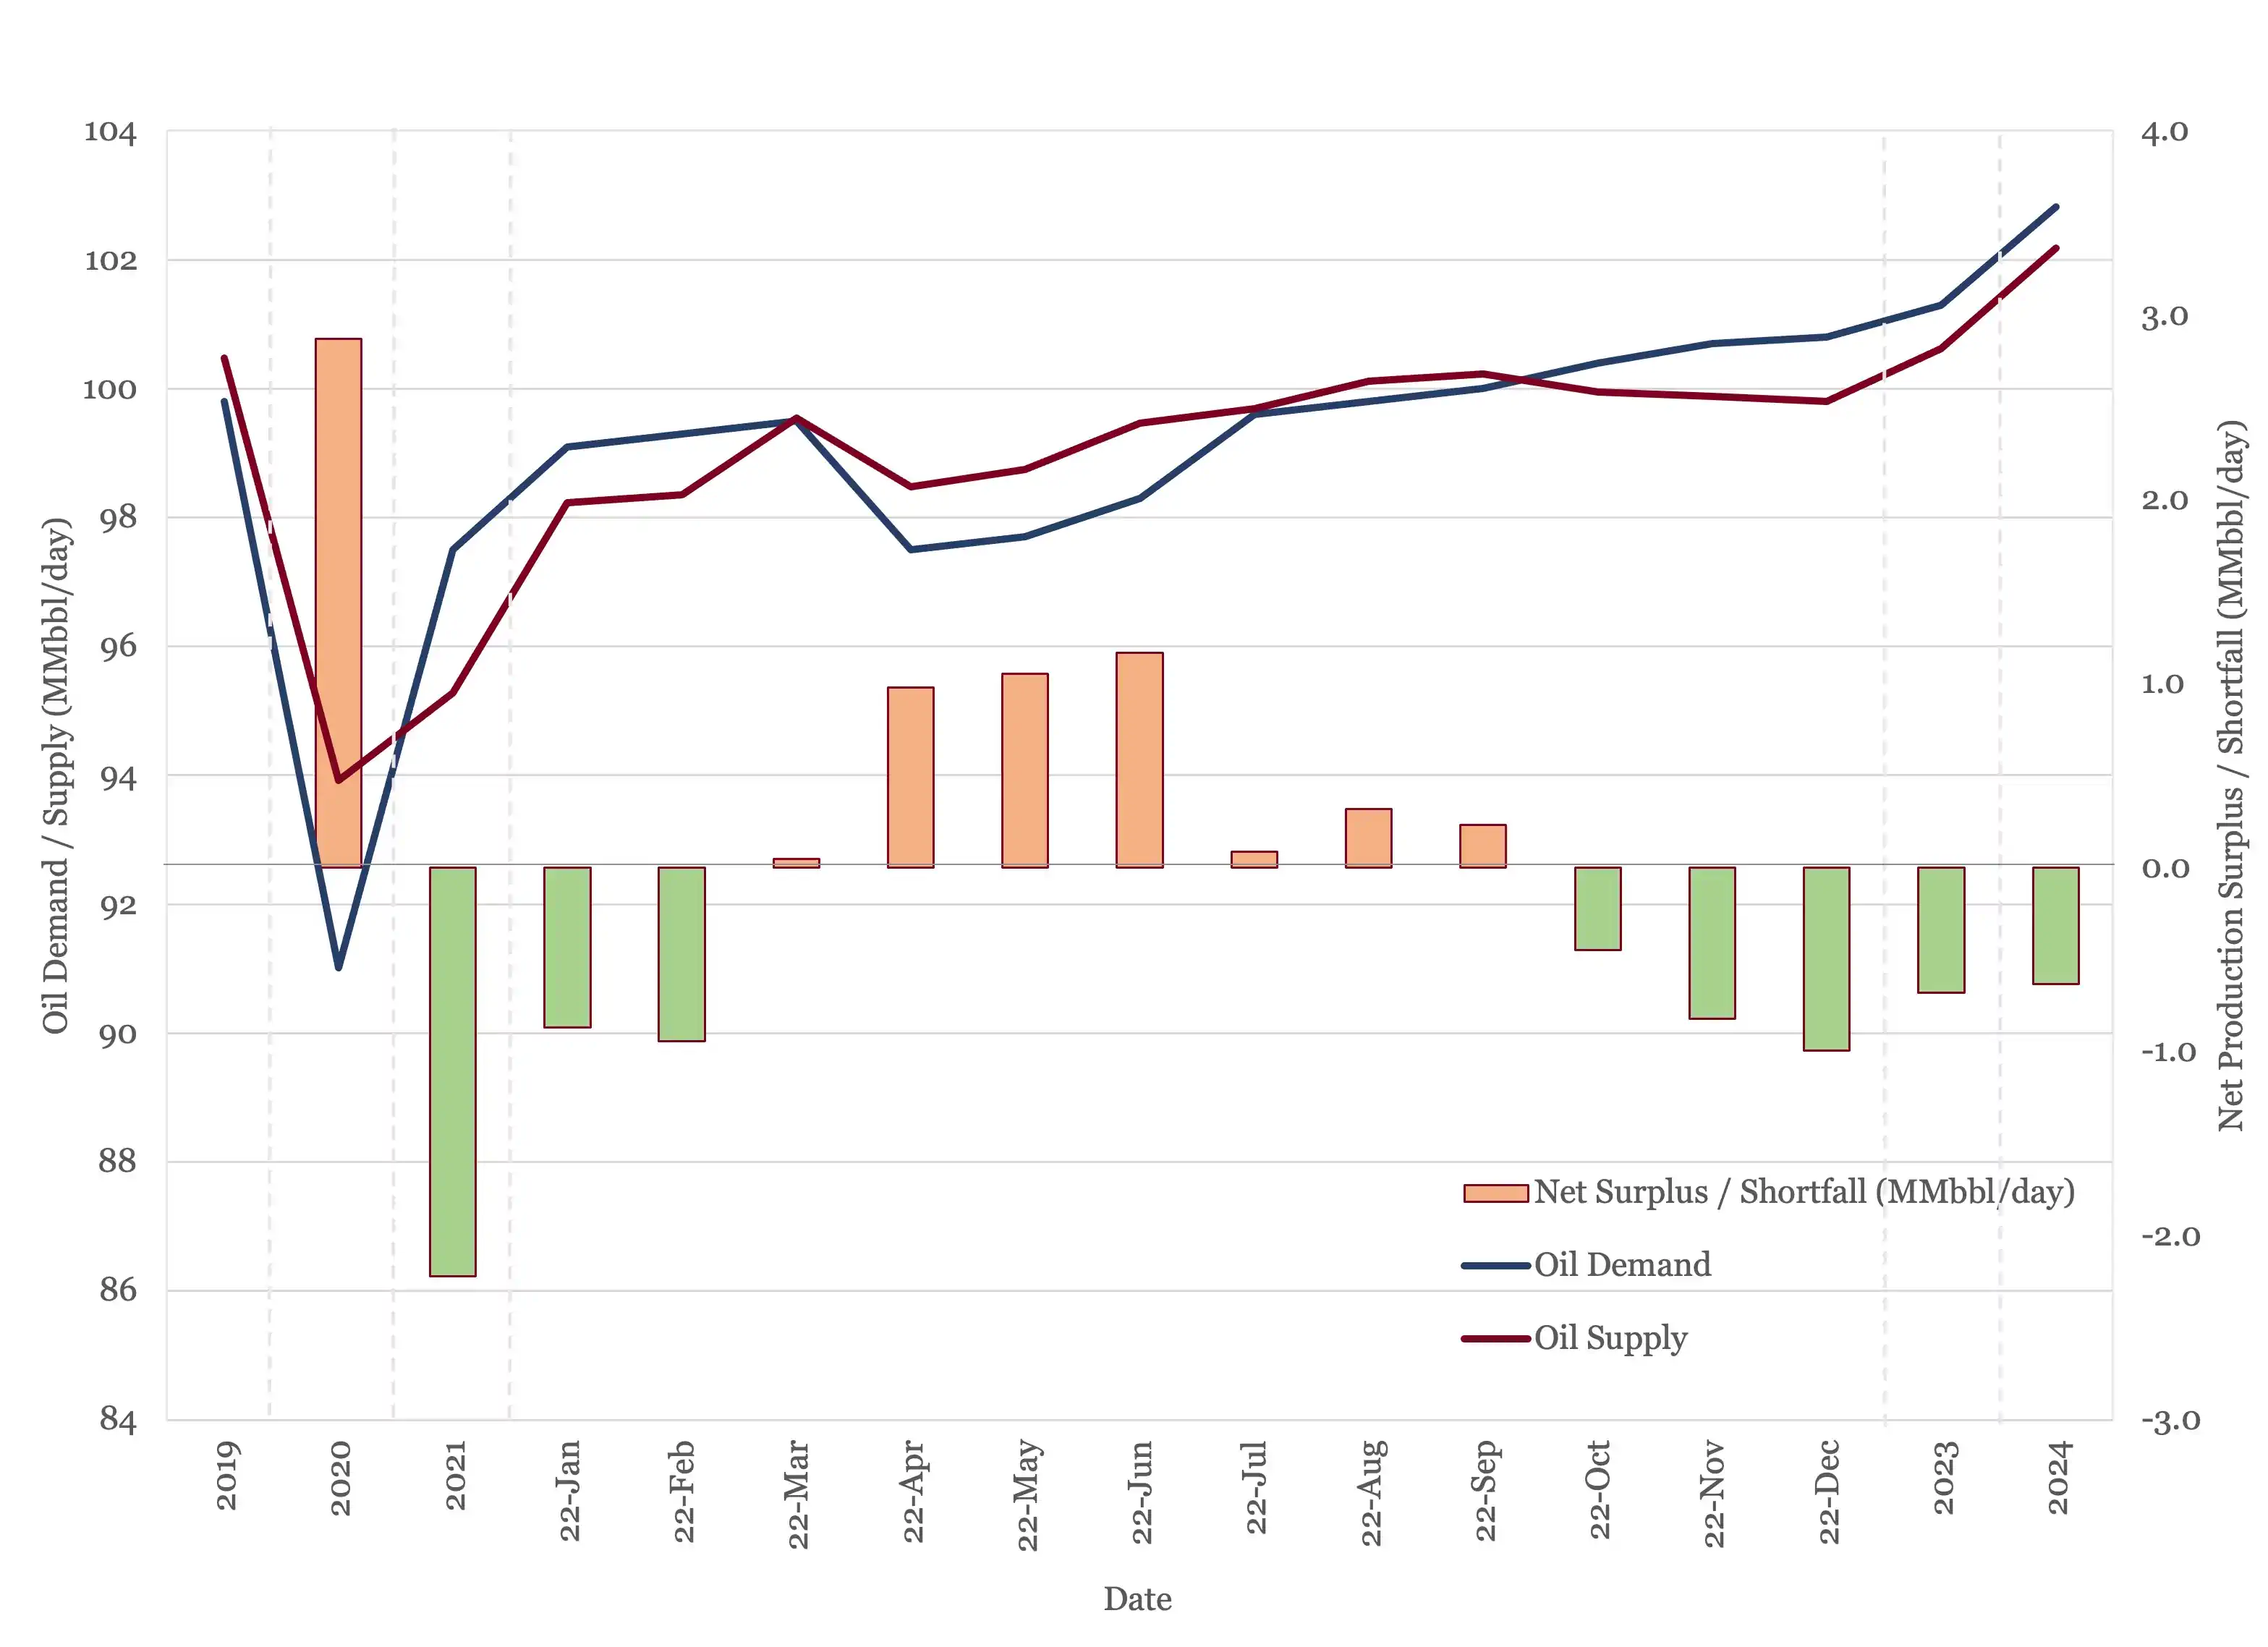
Figure 2 - Supply and Demand Surplus Forecast Prior to OPEC+ Production Cut
One of the key sensitivities in here is the assumption around Russian production next year, when the EU restrictions on trade and the EU / US Russian oil price cap is introduced (see last month’s Oil Market Forecast). We are assuming that Russian exports will average 9.7 MMbbl/day next year, but clearly oil market balance will be very sensitive to that figure. OPEC+ may be anticipating further falls in demand, or they may have factored in less of an impact from next year’s Russian sanctions. However, neither of those would provide a justification for introducing a supply cut now. OPEC+ have moved from monthly to bi-monthly meetings, so they will not meet again until December, and the next round of production targets will cover January and perhaps February 2023. Even considering this, global oil storage is below the 5-year average and demand is predicted to outstrip supply for this last quarter.
Having eliminated reconciliation of production targets with production, and concerns about oversupply, we are left to conclude that the production cut was probably undertaken to support oil prices; a strange thing to do in a tight market with an economy heading into recession. As discussed in the Oil Price section, any impact appears to have been short-lived. With the OPEC+ production cuts in place, and assuming that they are extended through 2023, the market looks very tight indeed, as shown in Figure 3.

Figure 3 - Supply and Demand Surplus Forecast
Oil Storage
The recent round of OPEC+ production cuts have pushed what was a flat 2022 into a stock draw of 118 MMbbl. The picture next year, if the latest targets are maintained, is a much larger stock draw of 789 MMbbl, close to the kind of drawdown OPEC+ managed in 2021. Based on this outlook, next year does not look like an opportune time to restock the SPR.
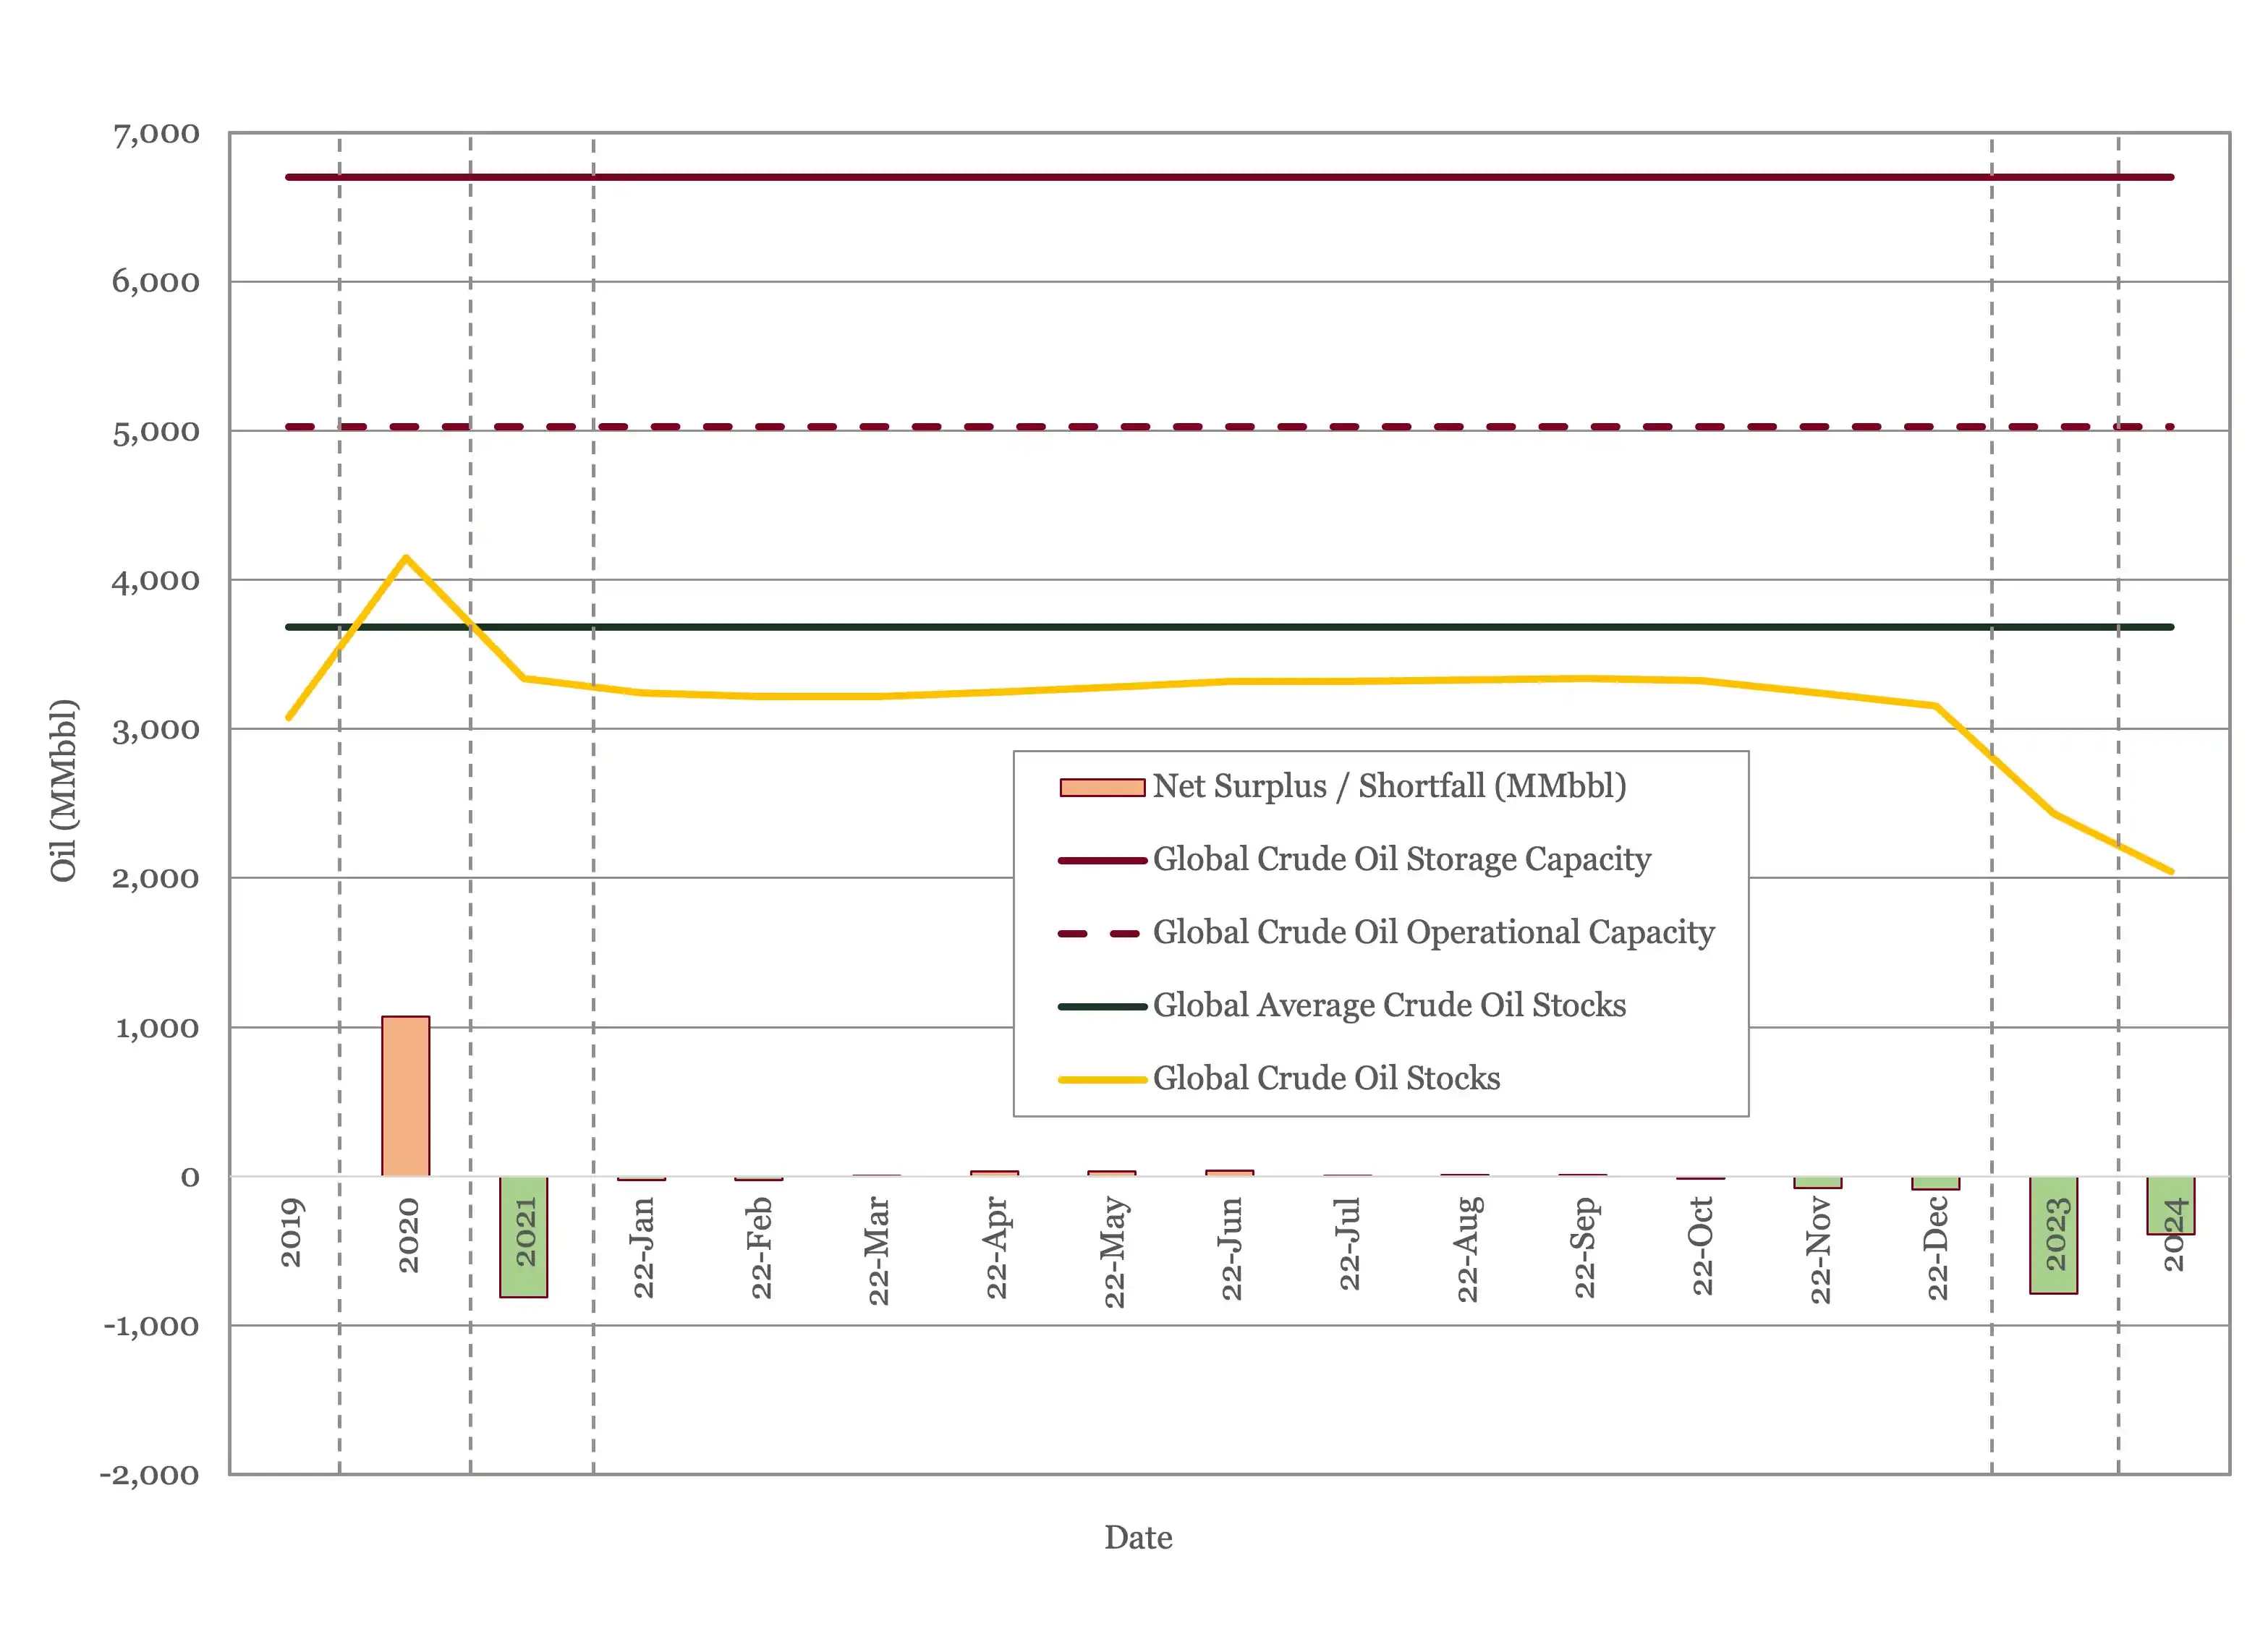
Figure 4 - Global Storage Chart
Oil Prices
Crude oil prices have moved up and down over the last month but ended where they started with Brent sitting at $85/bbl. There was a dip into the $70s after the SPR release announcement on the 19th of September, but prices had already climbed back above $80/bbl before the OPEC+ cut was announced on the 5th of October. Brent jumped briefly above $90/bbl but fell back quickly into the $80s.
Both Brent and WTI futures slipped this month, especially for contracts in the second half of the decade. Brent now dips under $70 in 2026, with WTI passing the same threshold in 2025.
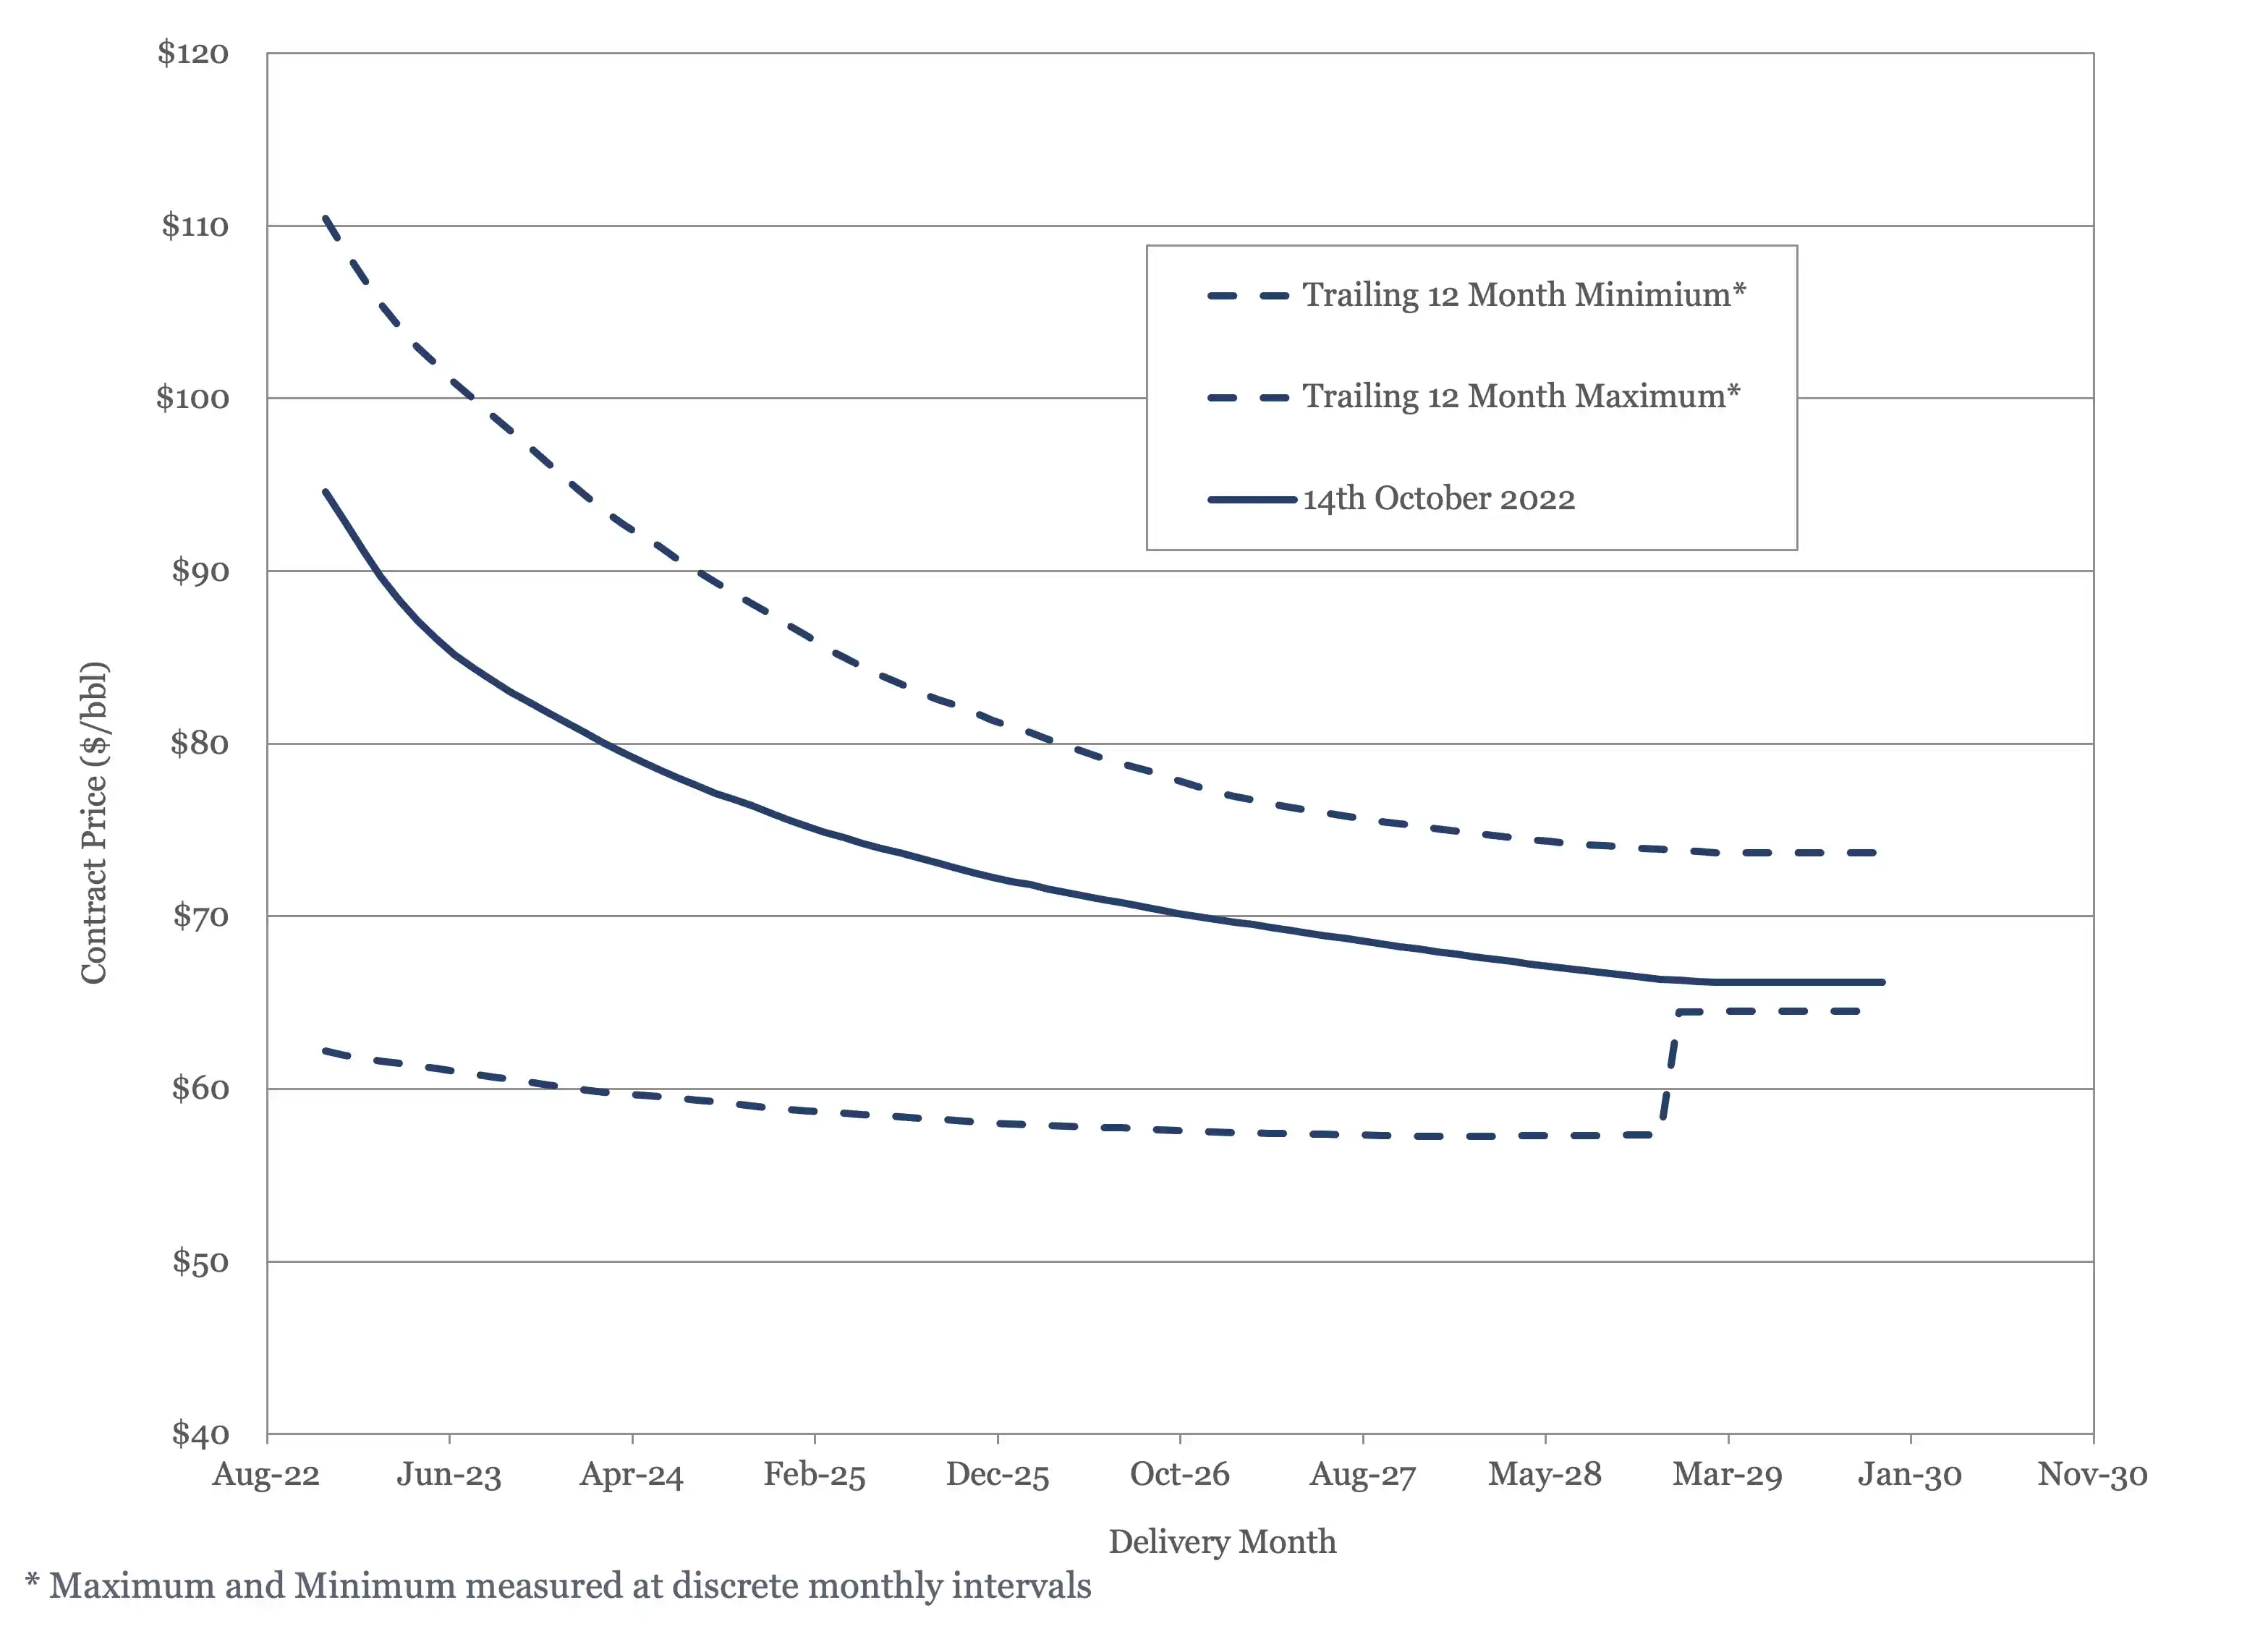
Figure 5 - Brent Crude Oil Futures

Figure 6 - WTI Crude Oil Futures
US Activity
The US land oil rig count did hit a new high at 594 last week, but generally growth does seem to have leveled off. Consequently, we have cut our estimate for US supply growth from 1.1 MMbbl/day to 900,000 bbl/day this year.
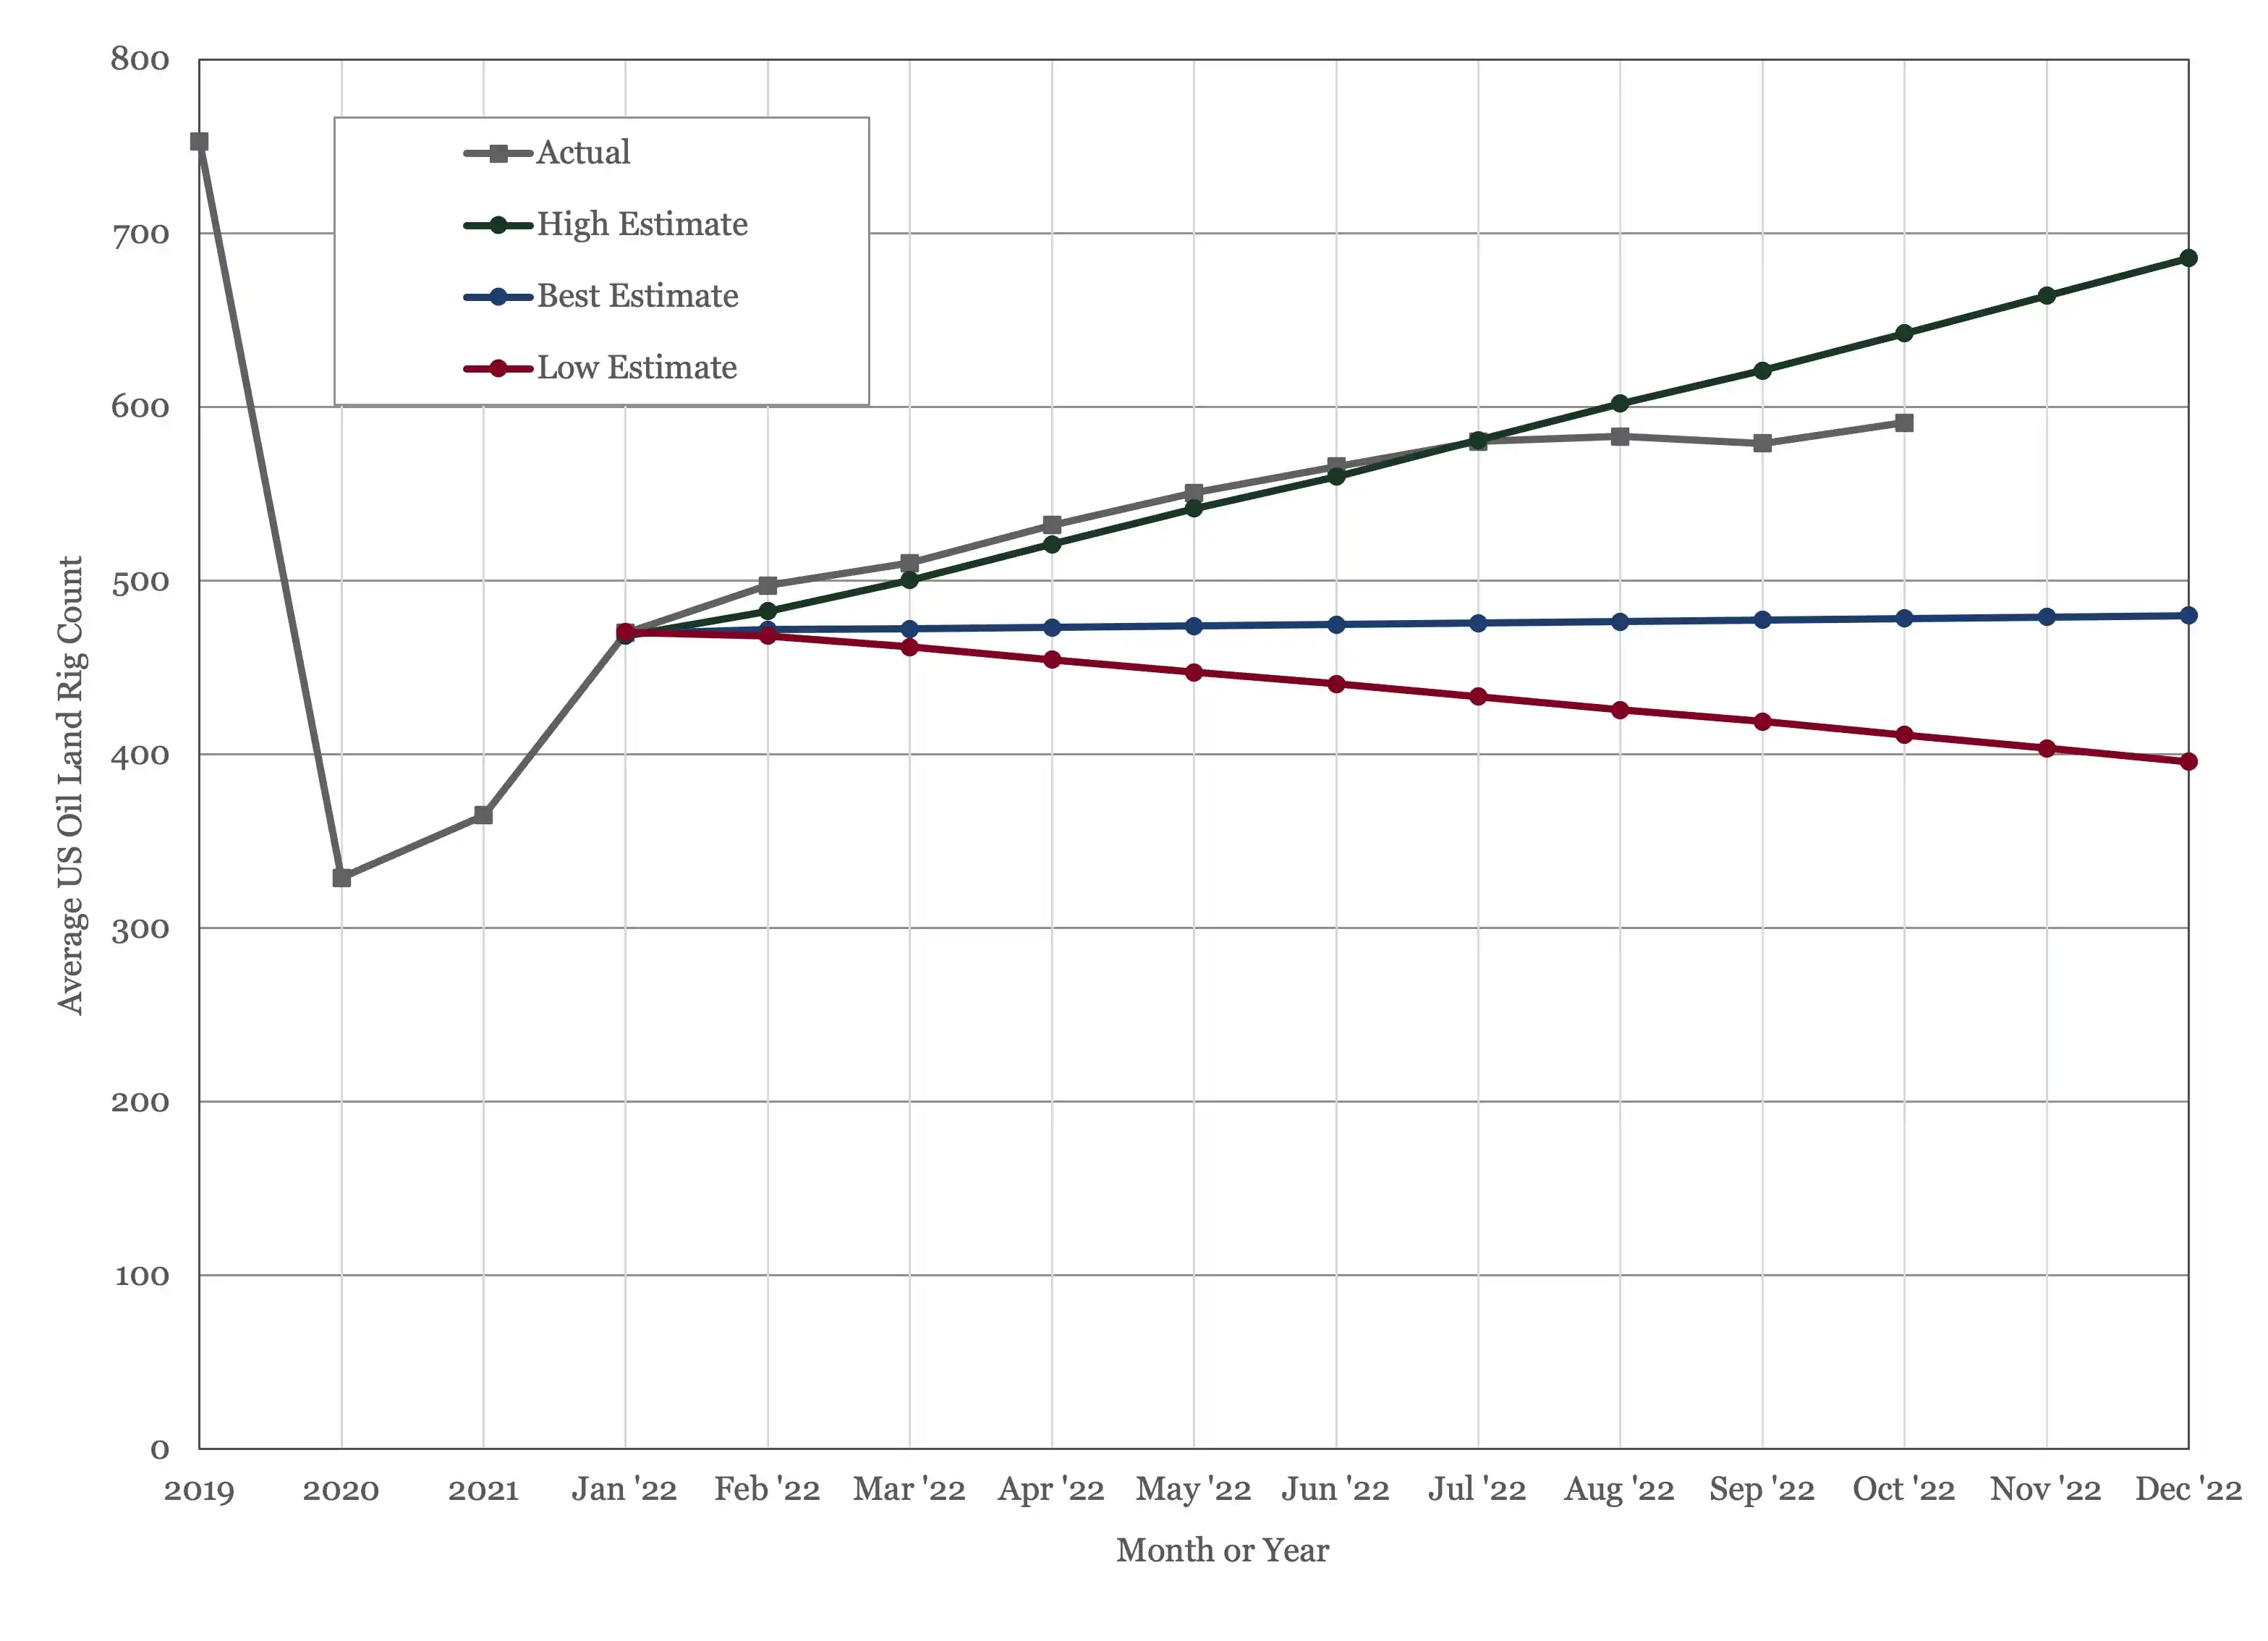
Figure 7 - US Land Oil Rig Count
(1) Oil Market Report – October 13th, 2022, IEA, Paris.
(2) “OPEC Monthly Oil Market Report”, Organization of the Petroleum Exporting Countries, October 12th, 2022.
(3) Short Term Energy Outlook (STEO), October 6th, 2022, U.S. Energy Information Administration.
(4) 33rd OPEC and non-OPEC Ministerial Meeting, October 5th, 2022.
(5) "America Has Lost Its Oil Buffer", Jingo Lee, The Wall Street Journal, September 22nd 2022.
Explore Our Services

Business Development
Oil & Gas an extractive industry, participants must continuously find and develop new oil & gas fields as existing fields decline, making business development a continuous process.

Strategy
We approach strategy through a scenario driven assessment of the client’s current portfolio, organizational competencies, and financial framework. The strategy defines portfolio actions and coveted asset attributes.

Origination
Deal origination consists of identifying coveted assets, assets with attributes consistent with the client’s strategy, and qualified buyers. We advocate a proactive approach to business development and will undertake outreach on our client’s behalf.

Transaction Support
Transaction support consists of in depth asset evaluation, negotiation of commercial agreements or preparation of license round submission and close out of conditions. We can also aid in joint venture set up and management and asset maturation as required.