Oil Market Forecast - September 2022
Summary
There has not been much in the way of sunny economic news since our last Oil Market Forecast in July. Oil prices have continued to slide since then, but the oil demand outlook has held more or less steady. Does the world need additional oil supply to meet this demand, and where will it come from? In this month’s forecast, we will look at spare capacity, potential sources of supply and how the latest round of Russian sanctions may impact that outlook.
A few key points:
- The IEA and EIA demand estimates for 2022 converged on 99.5 MMbbl/day, while OPEC kept their demand estimate flat at 100 MMbbl/day.
- The IEA, EIA and OPEC are predicting 2023 demand growth of 2.0 MMbbl/day to 2.7 MMbbl/day.
- Our view is that additional investment in oil production capacity is required to meet forecast demand.
- Both Brent and WTI futures markets are down again this month.
- The US land oil rig count appears to have hit a ceiling over the last couple of months, as it struggles to stay above 580.
Oil Supply and Demand
The IEA (1) lowered their 2022 oil demand estimate by 100,000 bbl/day to 99.5 MMbbl/day. The EIA (2) raised their 2022 demand estimate by 100,000 bbl/day to 99.5 MMbbl/day. OPEC (3) kept their 2022 demand estimate flat at 100.0 MMbbl/day. The IEA cut their 2023 demand estimate by 200,000 bbl/day to 101.6 MMbbl/day. Both the EIA and OPEC held their 2023 demand estimates steady at 101.5 MMbbl/day and 102.7 MMbbl/day respectively. This leaves the three reporting agencies predicting oil demand growth of 2.0 to 2.7 MMbbl/day in 2023, above trend for the last couple of decades and ahead of their main long term demand forecasts. Indeed, the IEA is predicting stronger demand growth in 2023 than in 2022, a COVID-19 rebound year. The IEA cites gas to oil switching as one of the main drivers for oil demand growth, something that should fall out again over the next few years as gas prices revert to their historical discount to oil.
Participants at the 32nd OPEC and non-OPEC Ministerial Meeting on September 5th (4), agreed to a production cut of 100,000 bbl/day for October, the first production cut in over a year. This meeting can perhaps be taken as the start of a return to normal operating conditions for OPEC+, after more than 18 months of gradually returning supply to market following the dramatic intervention in response to the COVID-19 induced demand collapse of 2020. The communique cites the impact of volatility and decline in liquidity of the current oil market, which would make a production cut counter intuitive. Some of the commentary surrounding the decision describes a schizophrenic oil market, where prices are falling despite a tight supply and demand balance. Given this context, the cut may be interpreted as an attempt to boost prices to better reflect what the OPEC+ countries believe to be the true state of supply and demand balance.
Whatever the interpretation, the cut will have no impact on physical markets, as OPEC+ continues to underproduce its official target by nearly 3.5 MMbbl/day. This substantial gap between production target and actual production has endured for so long, it is difficult to avoid the conclusion that OPEC+ is now producing at its full sustainable capacity. This is now acknowledged to a degree, as OPEC 10’s current production quota has been set above recognized sustainable production capacity for all of its members except the Gulf States.
At present, this failure to achieve target production is no bad thing. The oil market is essentially balanced this year, indeed if OPEC+ nations were actually producing on target, the oil market would be flooded. As we look to 2023, however, OPEC+ capacity becomes more of a concern. Based on today’s outlook, on the demand side, the world will need and additional 2.0 MMbbl/day to 2.7 MMbbl/day. Where will that additional supply come from? An Iranian nuclear deal is once more looking doubtful, eliminating the only potential source of substantial new supply that can be delivered quickly. OPEC expect the majority of supply growth next year, 1.2 MMbbl/day, to come from the US. This is on top of the 1.1 MMbbl/day that the US was expected to add in 2022. As we will talk about in the US section of this forecast, the US oil land rig count growth has stalled since July. According to our model, the rig count would need to grow on the same trajectory that we witnessed in the first half of the year to add 1.1 MMbbl/day. Unless rig count growth returns, we expect US production growth to reach 900,000 bbl/day this year, and only 300,000 bbl/day in 2023. The EIA is less optimistic, having revise their 2022 production growth forecast for the US down to 690,000 bbl/day.
Then there is the impact of additional Russian sanctions to consider. Sanctions on Russian oil exports have had little effect to date, with Russian oil output returning to pre-sanction levels in July as Russia simply directed its crude sales away from Europe and US by marketing at a discount. The Group of Seven (G7) countries had developed an extension of its original sanctions program that would have made exports more difficult by preventing trading, shipping and insurance firms located in G7 countries from dealing in Russian oil. This was due to come into effect at the beginning of 2023, but at some point, there seems to have been a recognition that there is simply not enough oil available in the global market to exclude Russian oil. Thus, on September 2nd, the G7 changed direction, to focus on limiting the revenue Russia could earn from its oil, rather than attempting to prevent its sale. Under the revised scheme, Russian oil can be exported via G7 infrastructure, but only if it is sold at a discount to market price, with the discount set by the G7. The G7 price will be set at above production cost and presumably below the $20-$30 per barrel discount that Russian oil is selling at. The intent is to keep the oil market supplied, while preventing Russia from profiting from sales of oil.
Will it work? We can’t think of a historical analogue to refer to for guidance. Our sense is that Russia will be reluctant to sell oil through the G7 discount mechanism, and a lot of nations outside of the G7 will be reluctant to participate.
How could 2023 play out in practice? Russia refuses to export its crude through the G7 mechanism, taking oil off the market and pushing prices up. The sanctions prevent G7 traders, shipping, and insurance companies from handling Russian crude, which creates a gap for non G7 traders, shipping, and insurance companies to step into. Most non-aligned countries continue to buy oil directly from Russia, at a discount set by Russia, through non G7 infrastructure. It will take some time, but eventually the non G7 export infrastructure will develop to the point that it can accommodate all of Russia’s oil. In many ways, this is similar to what happened with the initial set of sanctions. There was a shift in Russian supply to non-sanctioning countries and this shift occurred more quickly than expected. Under this scenario there would be a sharp supply deficit in early 2023, bringing very high prices, which would gradually resolve as non-G7 export infrastructure expands. Once this is infrastructure us fully developed, the world will have a parallel oil market for Russian crude, outside of the reach of G7 sanctions. This is probably not what the G7 intended.
Where does all of this leave the oil market? In our base forecast, we assume that the US adds 1.1 MMbbl/day in 2022, and that there is no Russian supply shock in 2023. In this scenario, the market looks balanced, with average supply of 99.4 MMbbl/day against average demand of 99.5 MMbbl/day. Things then tighten significantly in 2023 and 2024, as shown in Figure 1, with most of the risks to supply. As we have been saying in this forecast for some time, the world needs to invest more in oil production, or there will be a supply crunch in the next few years.
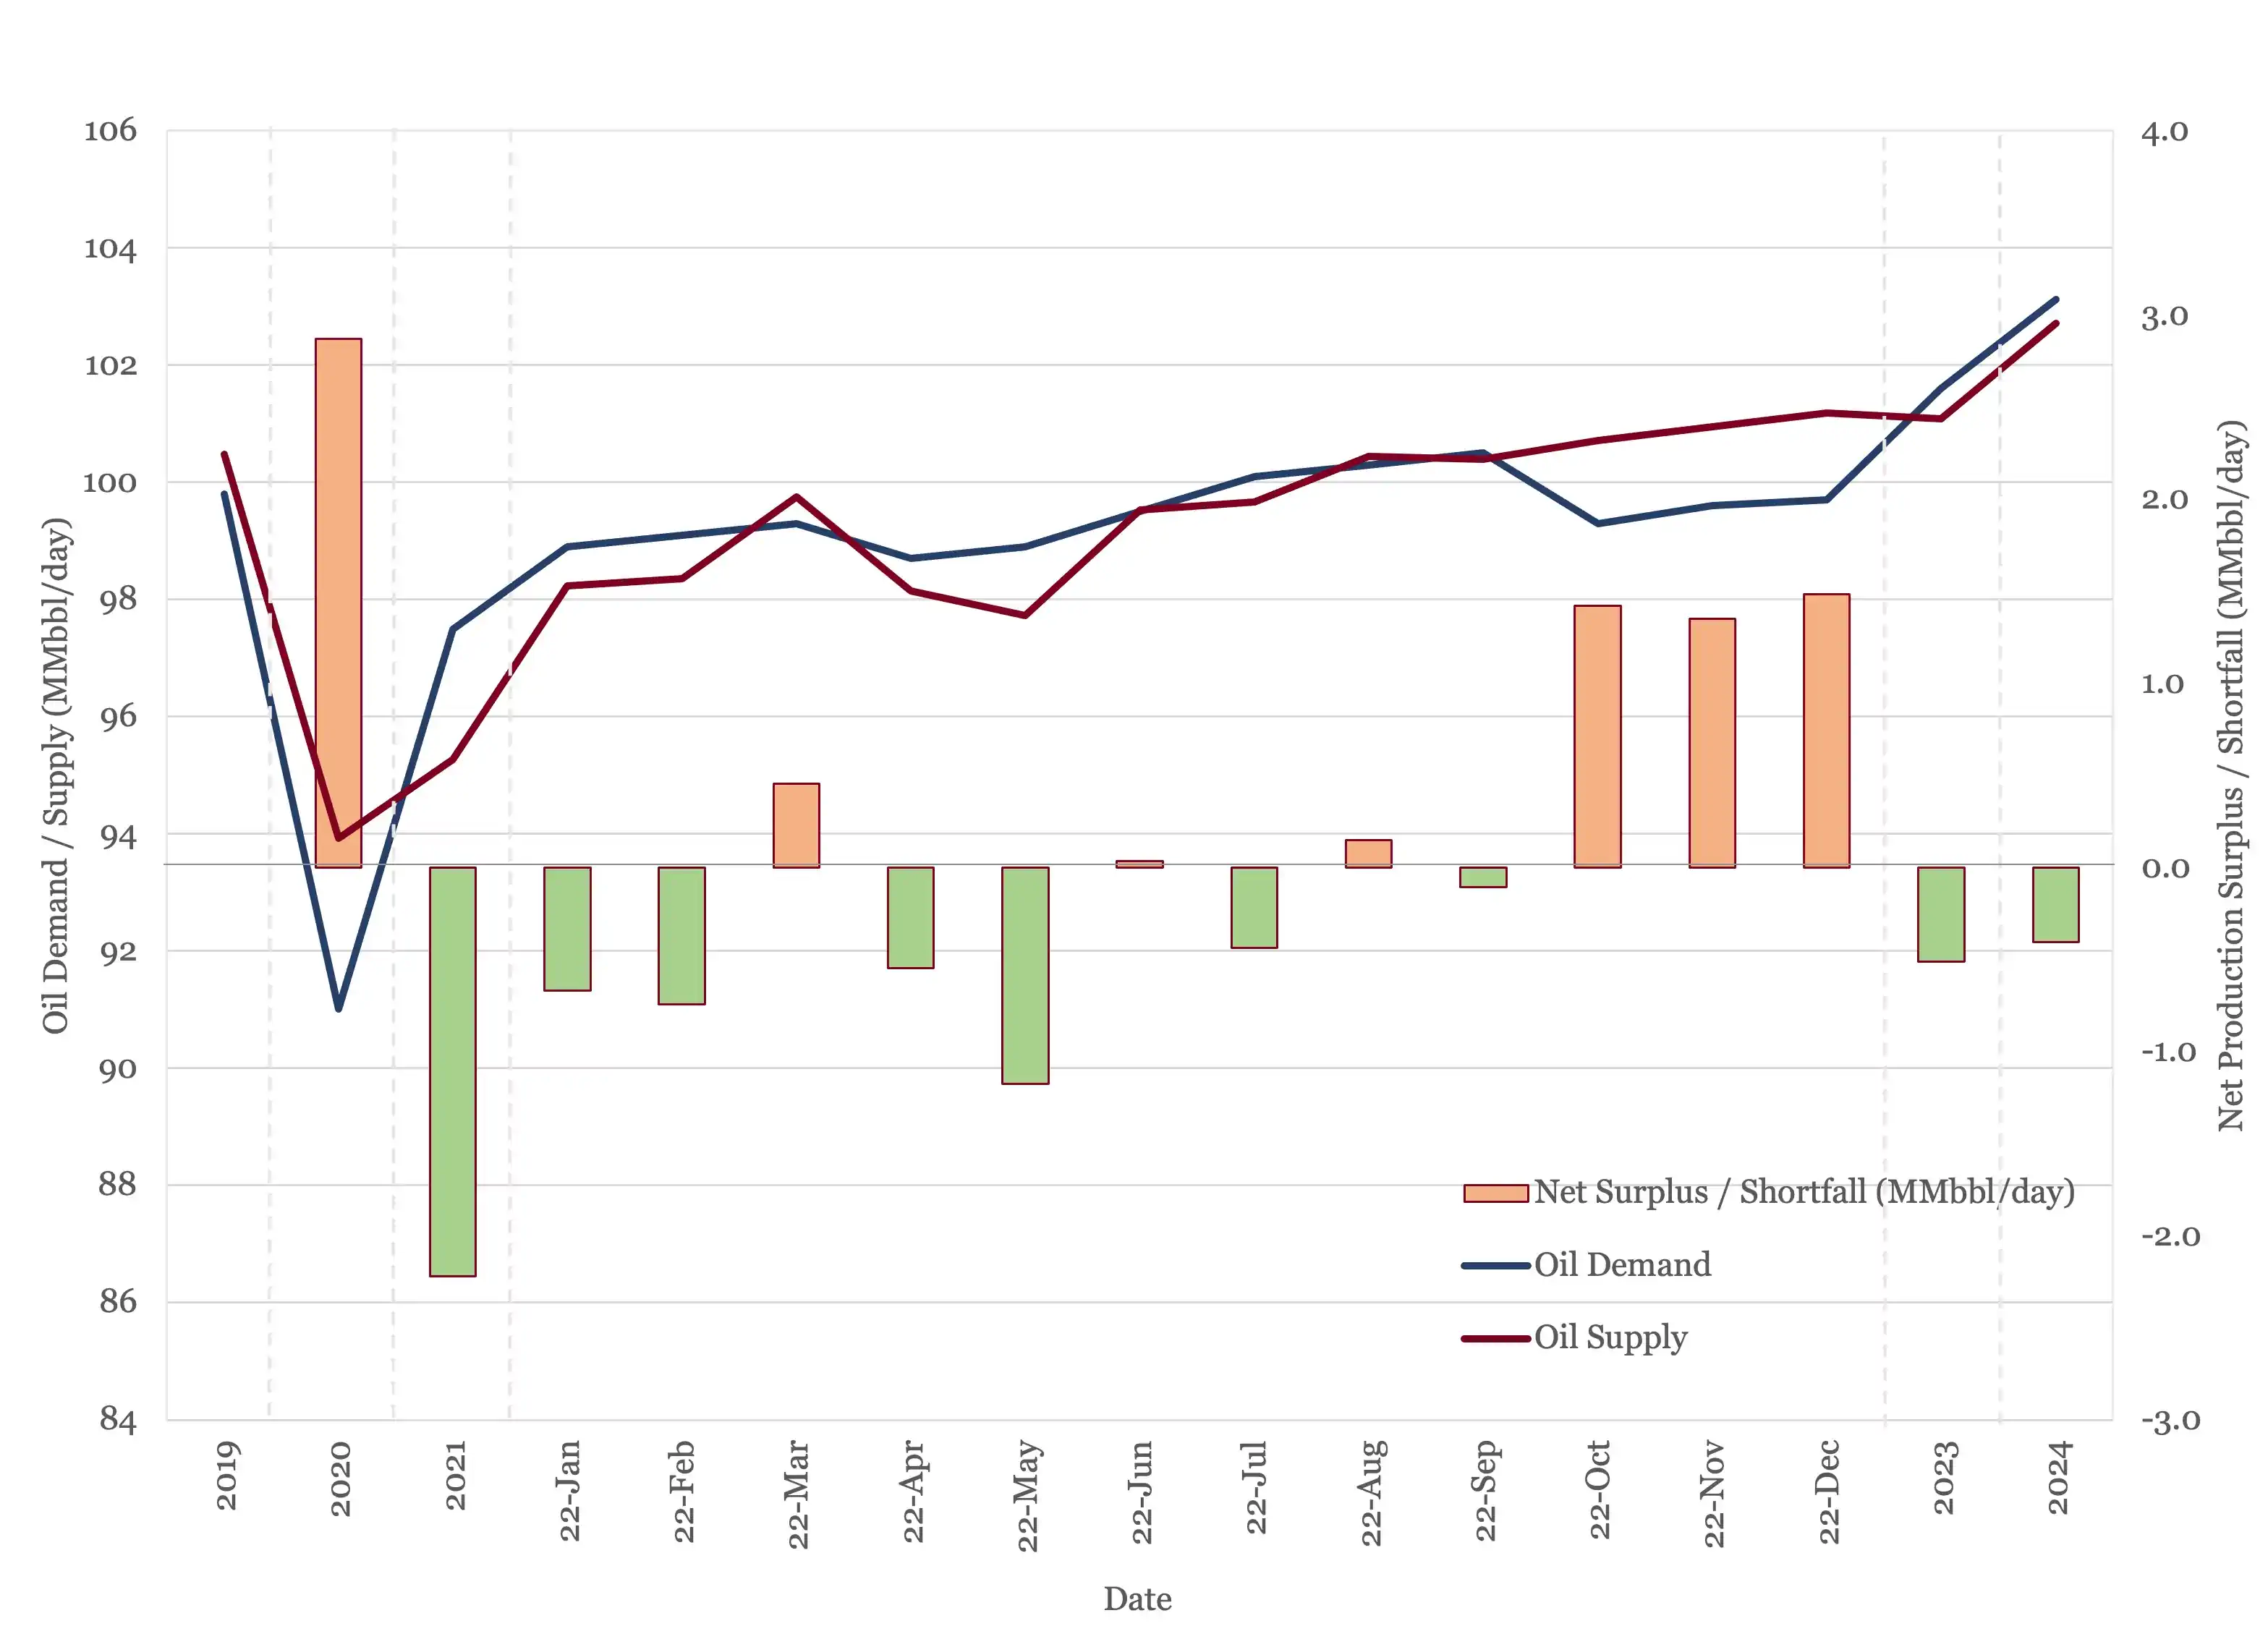
Figure 1 - Supply and Demand Surplus Forecast
Oil Storage
The stock picture for 2022 is essentially flat, with a net draw of 32 MMbbl. The gap widens in 2023, where we are predicting a draw of 186 MMbbl.

Figure 2 - Global Storage Chart
Oil Prices
Crude oil dipped under the $100/bbl mark in July and has been drifting downward ever since. It has been bouncing around $85/bbl so far this month, a level which will continue to provide the industry with healthy margins. Both Brent and WTI futures are down again this month, with Brent falling under $70/bbl in 2027 and WTI breaking through the same level in 2025.

Figure 3 - Brent Crude Oil Futures
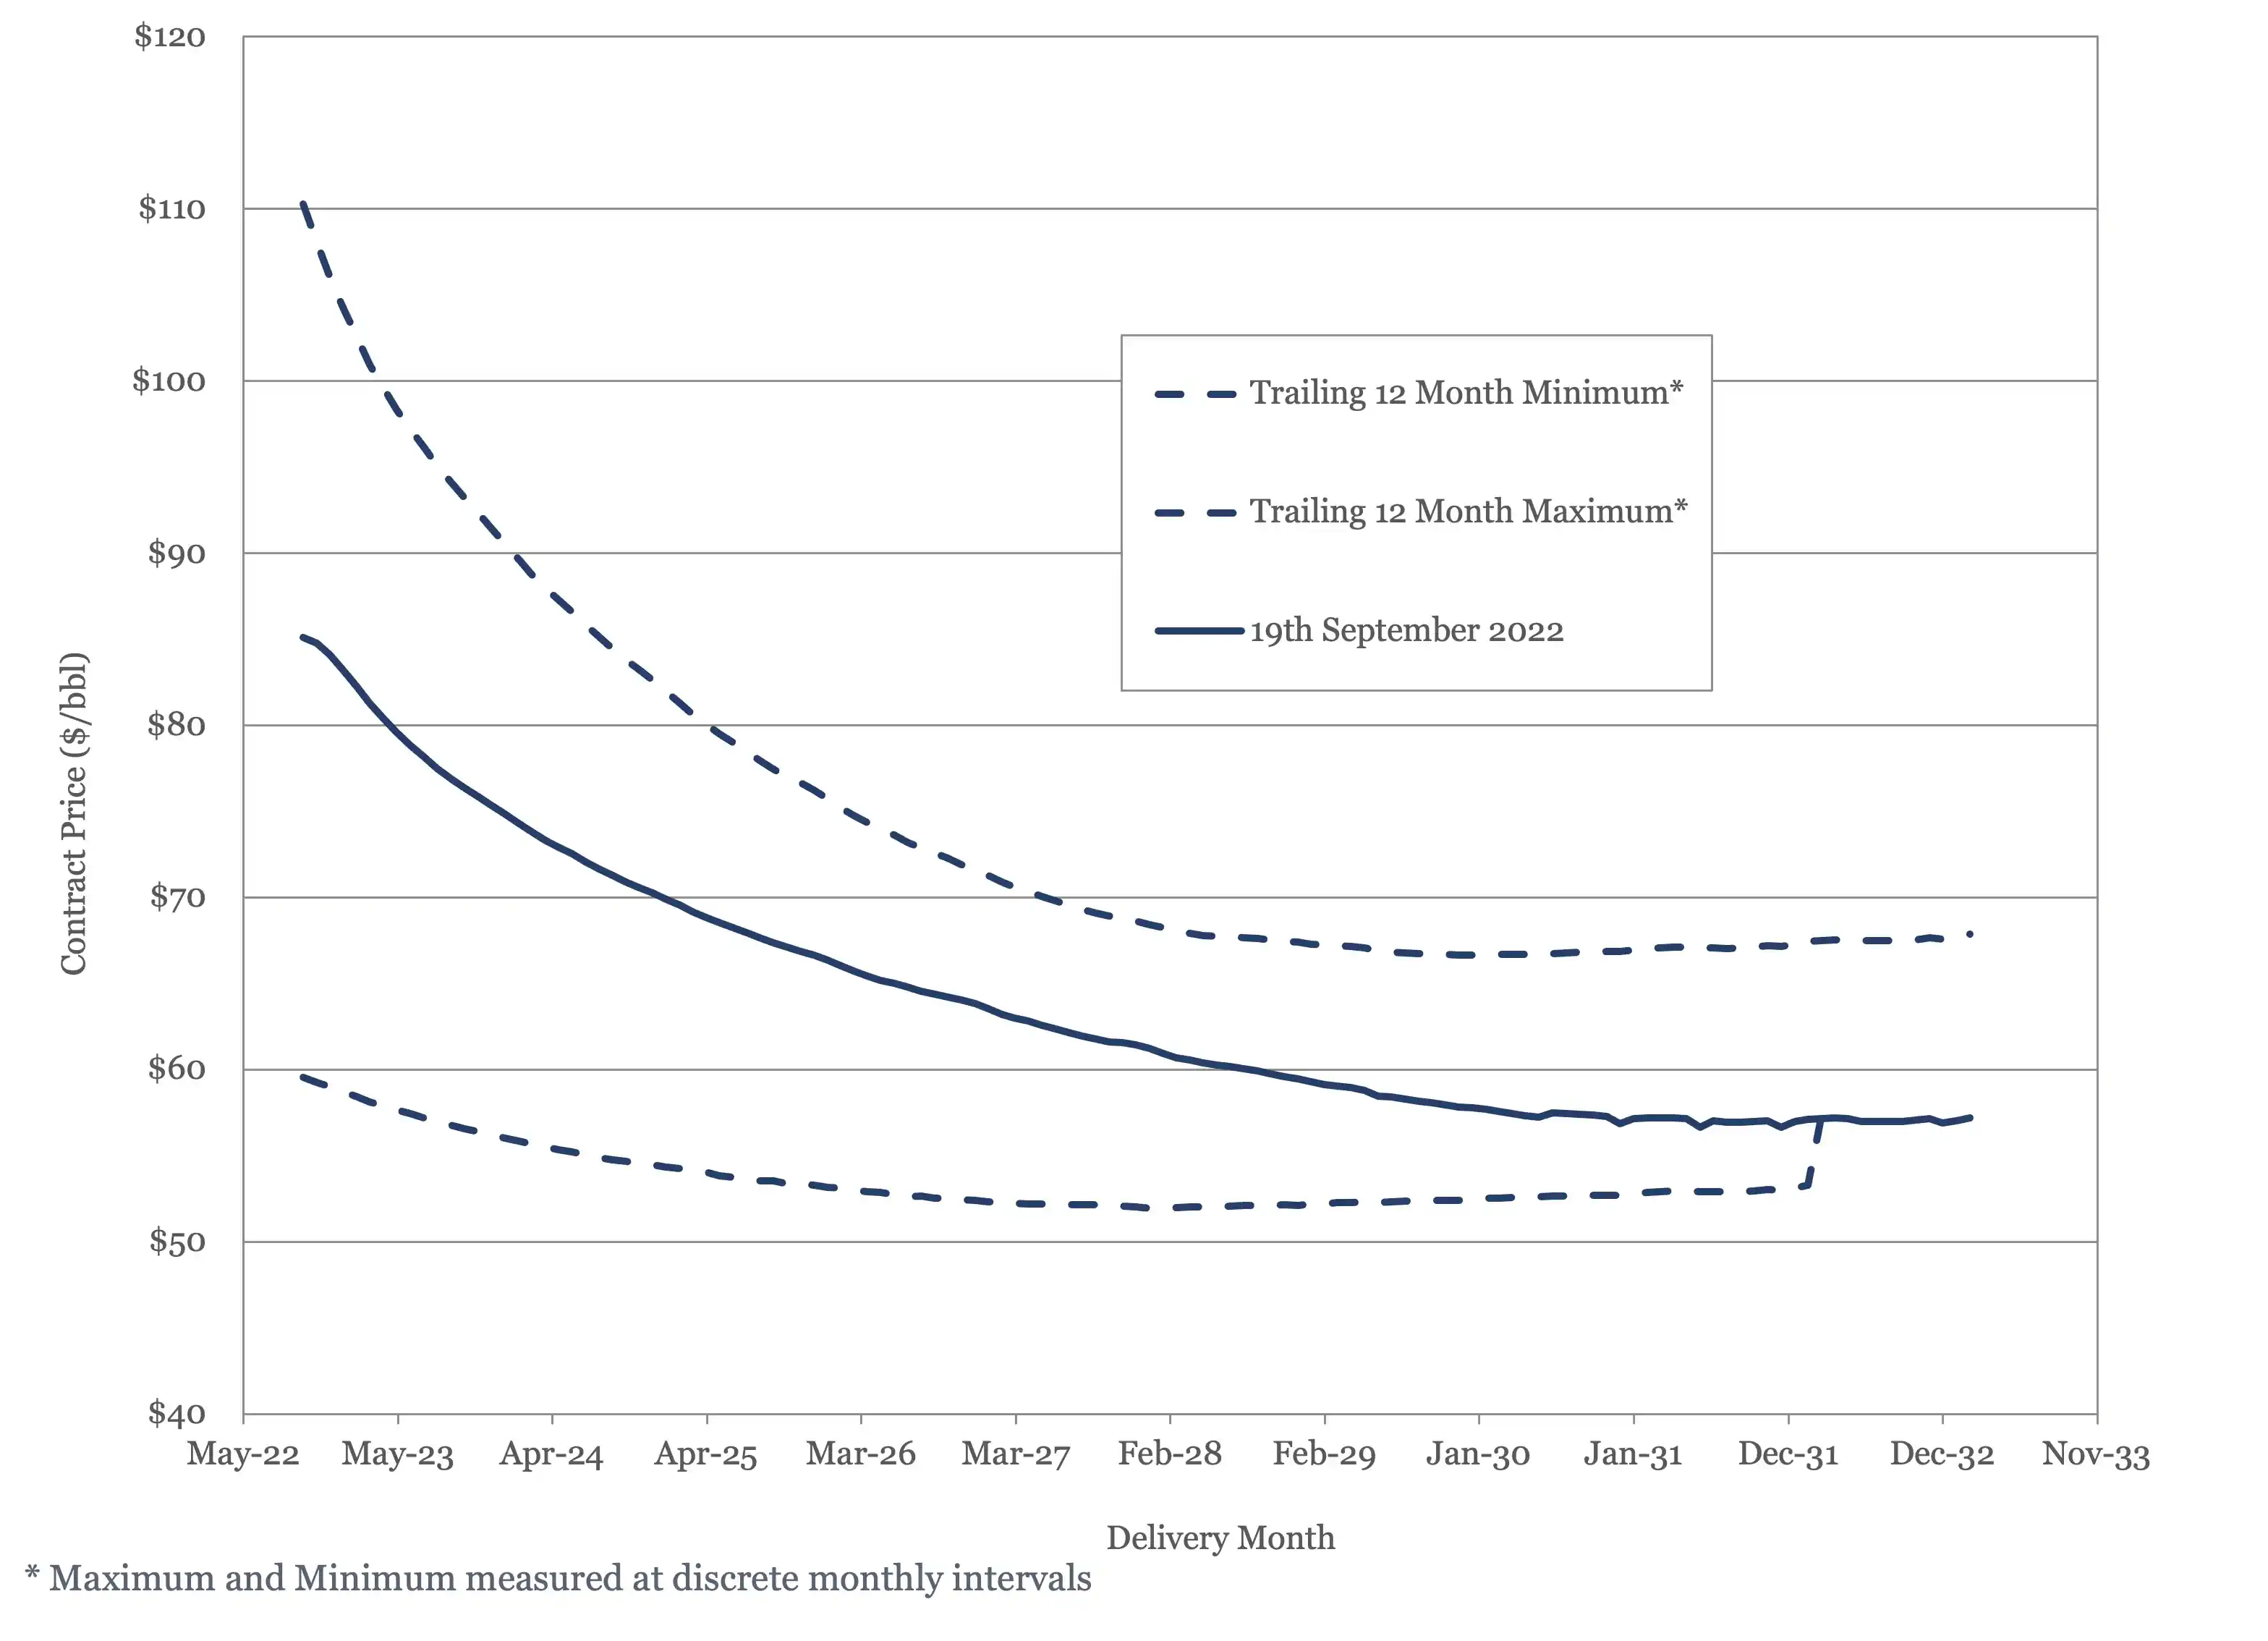
Figure 4 - WTI Crude Oil Futures
The present supply and demand balance doesn’t seem to justify current oil price levels. Stocks are below the 5 – year average, so there is an argument to support prices about the long-term average, but not at the $100/bbl and above level. Conversely, the outlook through 2025 is for the market to tighten, which should dictate rising prices over that period. This suggests we should see a normal, rather than an inverted, futures curve.
US Activity
The US land oil rig count seems to have leveled off over the last couple of months, hitting 586 on the 29th of July and 29th August, before falling back into the 570s. This has reignited the debate about how much activity the US domestic industry can support and what is limiting it – investor sentiment, inventory, services costs, or rig availability. The Wall Street Journal (5) recently reported that it is investors, specifically investors in public oil and gas companies, who are setting the ceiling, with the privately held oil companies having expanded as far as they are able. This reading is consistent with prior Dallas Federal Reserve surveys, which identified capital constraints as the limiting factor.
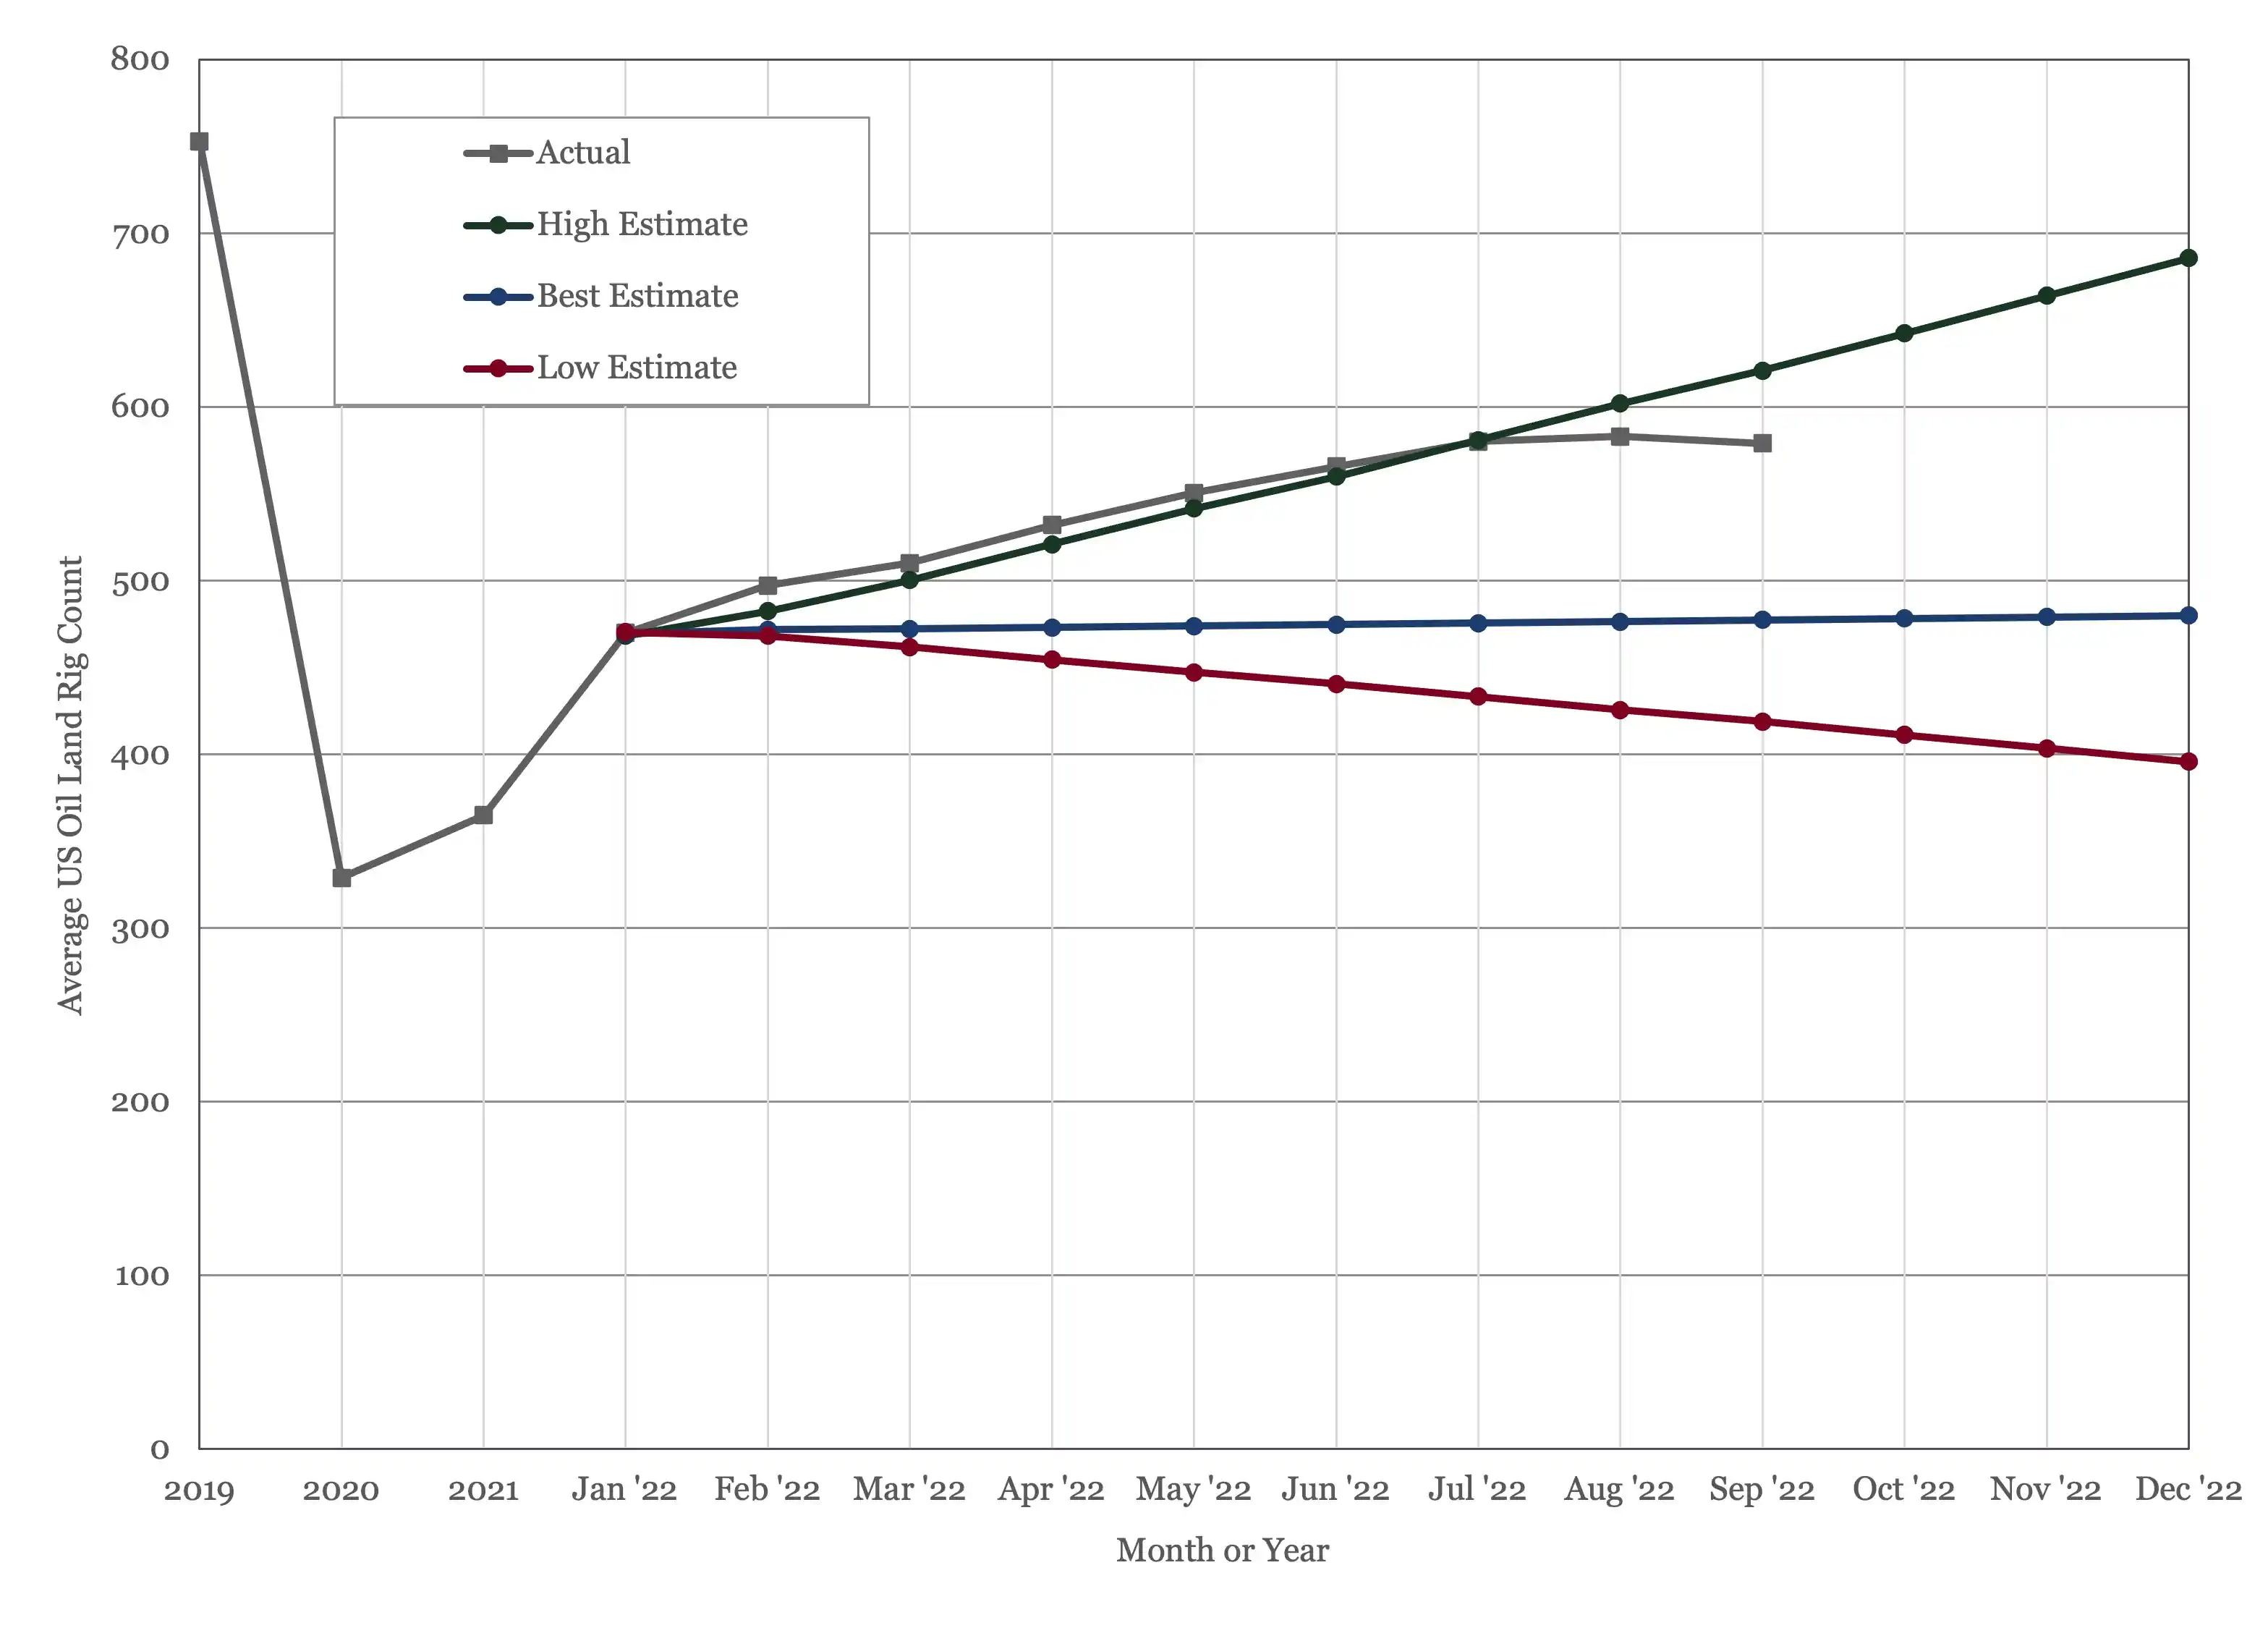
Figure 5 - US Land Oil Rig Count
(1) Oil Market Report – September 14th, 2022, IEA, Paris.
(2) Short Term Energy Outlook (STEO), September 7th, 2022, U.S. Energy Information Administration.
(3) “OPEC Monthly Oil Market Report”, Organization of the Petroleum Exporting Countries, September 13th, 2022.
(4) 32nd OPEC and non-OPEC Ministerial Meeting, September 5th, 2022.
(5) “Private Oil Drillers Are Hitting Their Limits”, Collin Eaton and Benoît Morenne, The Wall Street Journal, September 19th, 2022.


Oil Market Forecast - September 2022
Summary
There has not been much in the way of sunny economic news since our last Oil Market Forecast in July. Oil prices have continued to slide since then, but the oil demand outlook has held more or less steady. Does the world need additional oil supply to meet this demand, and where will it come from? In this month’s forecast, we will look at spare capacity, potential sources of supply and how the latest round of Russian sanctions may impact that outlook.
A few key points:
- The IEA and EIA demand estimates for 2022 converged on 99.5 MMbbl/day, while OPEC kept their demand estimate flat at 100 MMbbl/day.
- The IEA, EIA and OPEC are predicting 2023 demand growth of 2.0 MMbbl/day to 2.7 MMbbl/day.
- Our view is that additional investment in oil production capacity is required to meet forecast demand.
- Both Brent and WTI futures markets are down again this month.
- The US land oil rig count appears to have hit a ceiling over the last couple of months, as it struggles to stay above 580.
Oil Supply and Demand
The IEA (1) lowered their 2022 oil demand estimate by 100,000 bbl/day to 99.5 MMbbl/day. The EIA (2) raised their 2022 demand estimate by 100,000 bbl/day to 99.5 MMbbl/day. OPEC (3) kept their 2022 demand estimate flat at 100.0 MMbbl/day. The IEA cut their 2023 demand estimate by 200,000 bbl/day to 101.6 MMbbl/day. Both the EIA and OPEC held their 2023 demand estimates steady at 101.5 MMbbl/day and 102.7 MMbbl/day respectively. This leaves the three reporting agencies predicting oil demand growth of 2.0 to 2.7 MMbbl/day in 2023, above trend for the last couple of decades and ahead of their main long term demand forecasts. Indeed, the IEA is predicting stronger demand growth in 2023 than in 2022, a COVID-19 rebound year. The IEA cites gas to oil switching as one of the main drivers for oil demand growth, something that should fall out again over the next few years as gas prices revert to their historical discount to oil.
Participants at the 32nd OPEC and non-OPEC Ministerial Meeting on September 5th (4), agreed to a production cut of 100,000 bbl/day for October, the first production cut in over a year. This meeting can perhaps be taken as the start of a return to normal operating conditions for OPEC+, after more than 18 months of gradually returning supply to market following the dramatic intervention in response to the COVID-19 induced demand collapse of 2020. The communique cites the impact of volatility and decline in liquidity of the current oil market, which would make a production cut counter intuitive. Some of the commentary surrounding the decision describes a schizophrenic oil market, where prices are falling despite a tight supply and demand balance. Given this context, the cut may be interpreted as an attempt to boost prices to better reflect what the OPEC+ countries believe to be the true state of supply and demand balance.
Whatever the interpretation, the cut will have no impact on physical markets, as OPEC+ continues to underproduce its official target by nearly 3.5 MMbbl/day. This substantial gap between production target and actual production has endured for so long, it is difficult to avoid the conclusion that OPEC+ is now producing at its full sustainable capacity. This is now acknowledged to a degree, as OPEC 10’s current production quota has been set above recognized sustainable production capacity for all of its members except the Gulf States.
At present, this failure to achieve target production is no bad thing. The oil market is essentially balanced this year, indeed if OPEC+ nations were actually producing on target, the oil market would be flooded. As we look to 2023, however, OPEC+ capacity becomes more of a concern. Based on today’s outlook, on the demand side, the world will need and additional 2.0 MMbbl/day to 2.7 MMbbl/day. Where will that additional supply come from? An Iranian nuclear deal is once more looking doubtful, eliminating the only potential source of substantial new supply that can be delivered quickly. OPEC expect the majority of supply growth next year, 1.2 MMbbl/day, to come from the US. This is on top of the 1.1 MMbbl/day that the US was expected to add in 2022. As we will talk about in the US section of this forecast, the US oil land rig count growth has stalled since July. According to our model, the rig count would need to grow on the same trajectory that we witnessed in the first half of the year to add 1.1 MMbbl/day. Unless rig count growth returns, we expect US production growth to reach 900,000 bbl/day this year, and only 300,000 bbl/day in 2023. The EIA is less optimistic, having revise their 2022 production growth forecast for the US down to 690,000 bbl/day.
Then there is the impact of additional Russian sanctions to consider. Sanctions on Russian oil exports have had little effect to date, with Russian oil output returning to pre-sanction levels in July as Russia simply directed its crude sales away from Europe and US by marketing at a discount. The Group of Seven (G7) countries had developed an extension of its original sanctions program that would have made exports more difficult by preventing trading, shipping and insurance firms located in G7 countries from dealing in Russian oil. This was due to come into effect at the beginning of 2023, but at some point, there seems to have been a recognition that there is simply not enough oil available in the global market to exclude Russian oil. Thus, on September 2nd, the G7 changed direction, to focus on limiting the revenue Russia could earn from its oil, rather than attempting to prevent its sale. Under the revised scheme, Russian oil can be exported via G7 infrastructure, but only if it is sold at a discount to market price, with the discount set by the G7. The G7 price will be set at above production cost and presumably below the $20-$30 per barrel discount that Russian oil is selling at. The intent is to keep the oil market supplied, while preventing Russia from profiting from sales of oil.
Will it work? We can’t think of a historical analogue to refer to for guidance. Our sense is that Russia will be reluctant to sell oil through the G7 discount mechanism, and a lot of nations outside of the G7 will be reluctant to participate.
How could 2023 play out in practice? Russia refuses to export its crude through the G7 mechanism, taking oil off the market and pushing prices up. The sanctions prevent G7 traders, shipping, and insurance companies from handling Russian crude, which creates a gap for non G7 traders, shipping, and insurance companies to step into. Most non-aligned countries continue to buy oil directly from Russia, at a discount set by Russia, through non G7 infrastructure. It will take some time, but eventually the non G7 export infrastructure will develop to the point that it can accommodate all of Russia’s oil. In many ways, this is similar to what happened with the initial set of sanctions. There was a shift in Russian supply to non-sanctioning countries and this shift occurred more quickly than expected. Under this scenario there would be a sharp supply deficit in early 2023, bringing very high prices, which would gradually resolve as non-G7 export infrastructure expands. Once this is infrastructure us fully developed, the world will have a parallel oil market for Russian crude, outside of the reach of G7 sanctions. This is probably not what the G7 intended.
Where does all of this leave the oil market? In our base forecast, we assume that the US adds 1.1 MMbbl/day in 2022, and that there is no Russian supply shock in 2023. In this scenario, the market looks balanced, with average supply of 99.4 MMbbl/day against average demand of 99.5 MMbbl/day. Things then tighten significantly in 2023 and 2024, as shown in Figure 1, with most of the risks to supply. As we have been saying in this forecast for some time, the world needs to invest more in oil production, or there will be a supply crunch in the next few years.

Figure 1 - Supply and Demand Surplus Forecast
Oil Storage
The stock picture for 2022 is essentially flat, with a net draw of 32 MMbbl. The gap widens in 2023, where we are predicting a draw of 186 MMbbl.
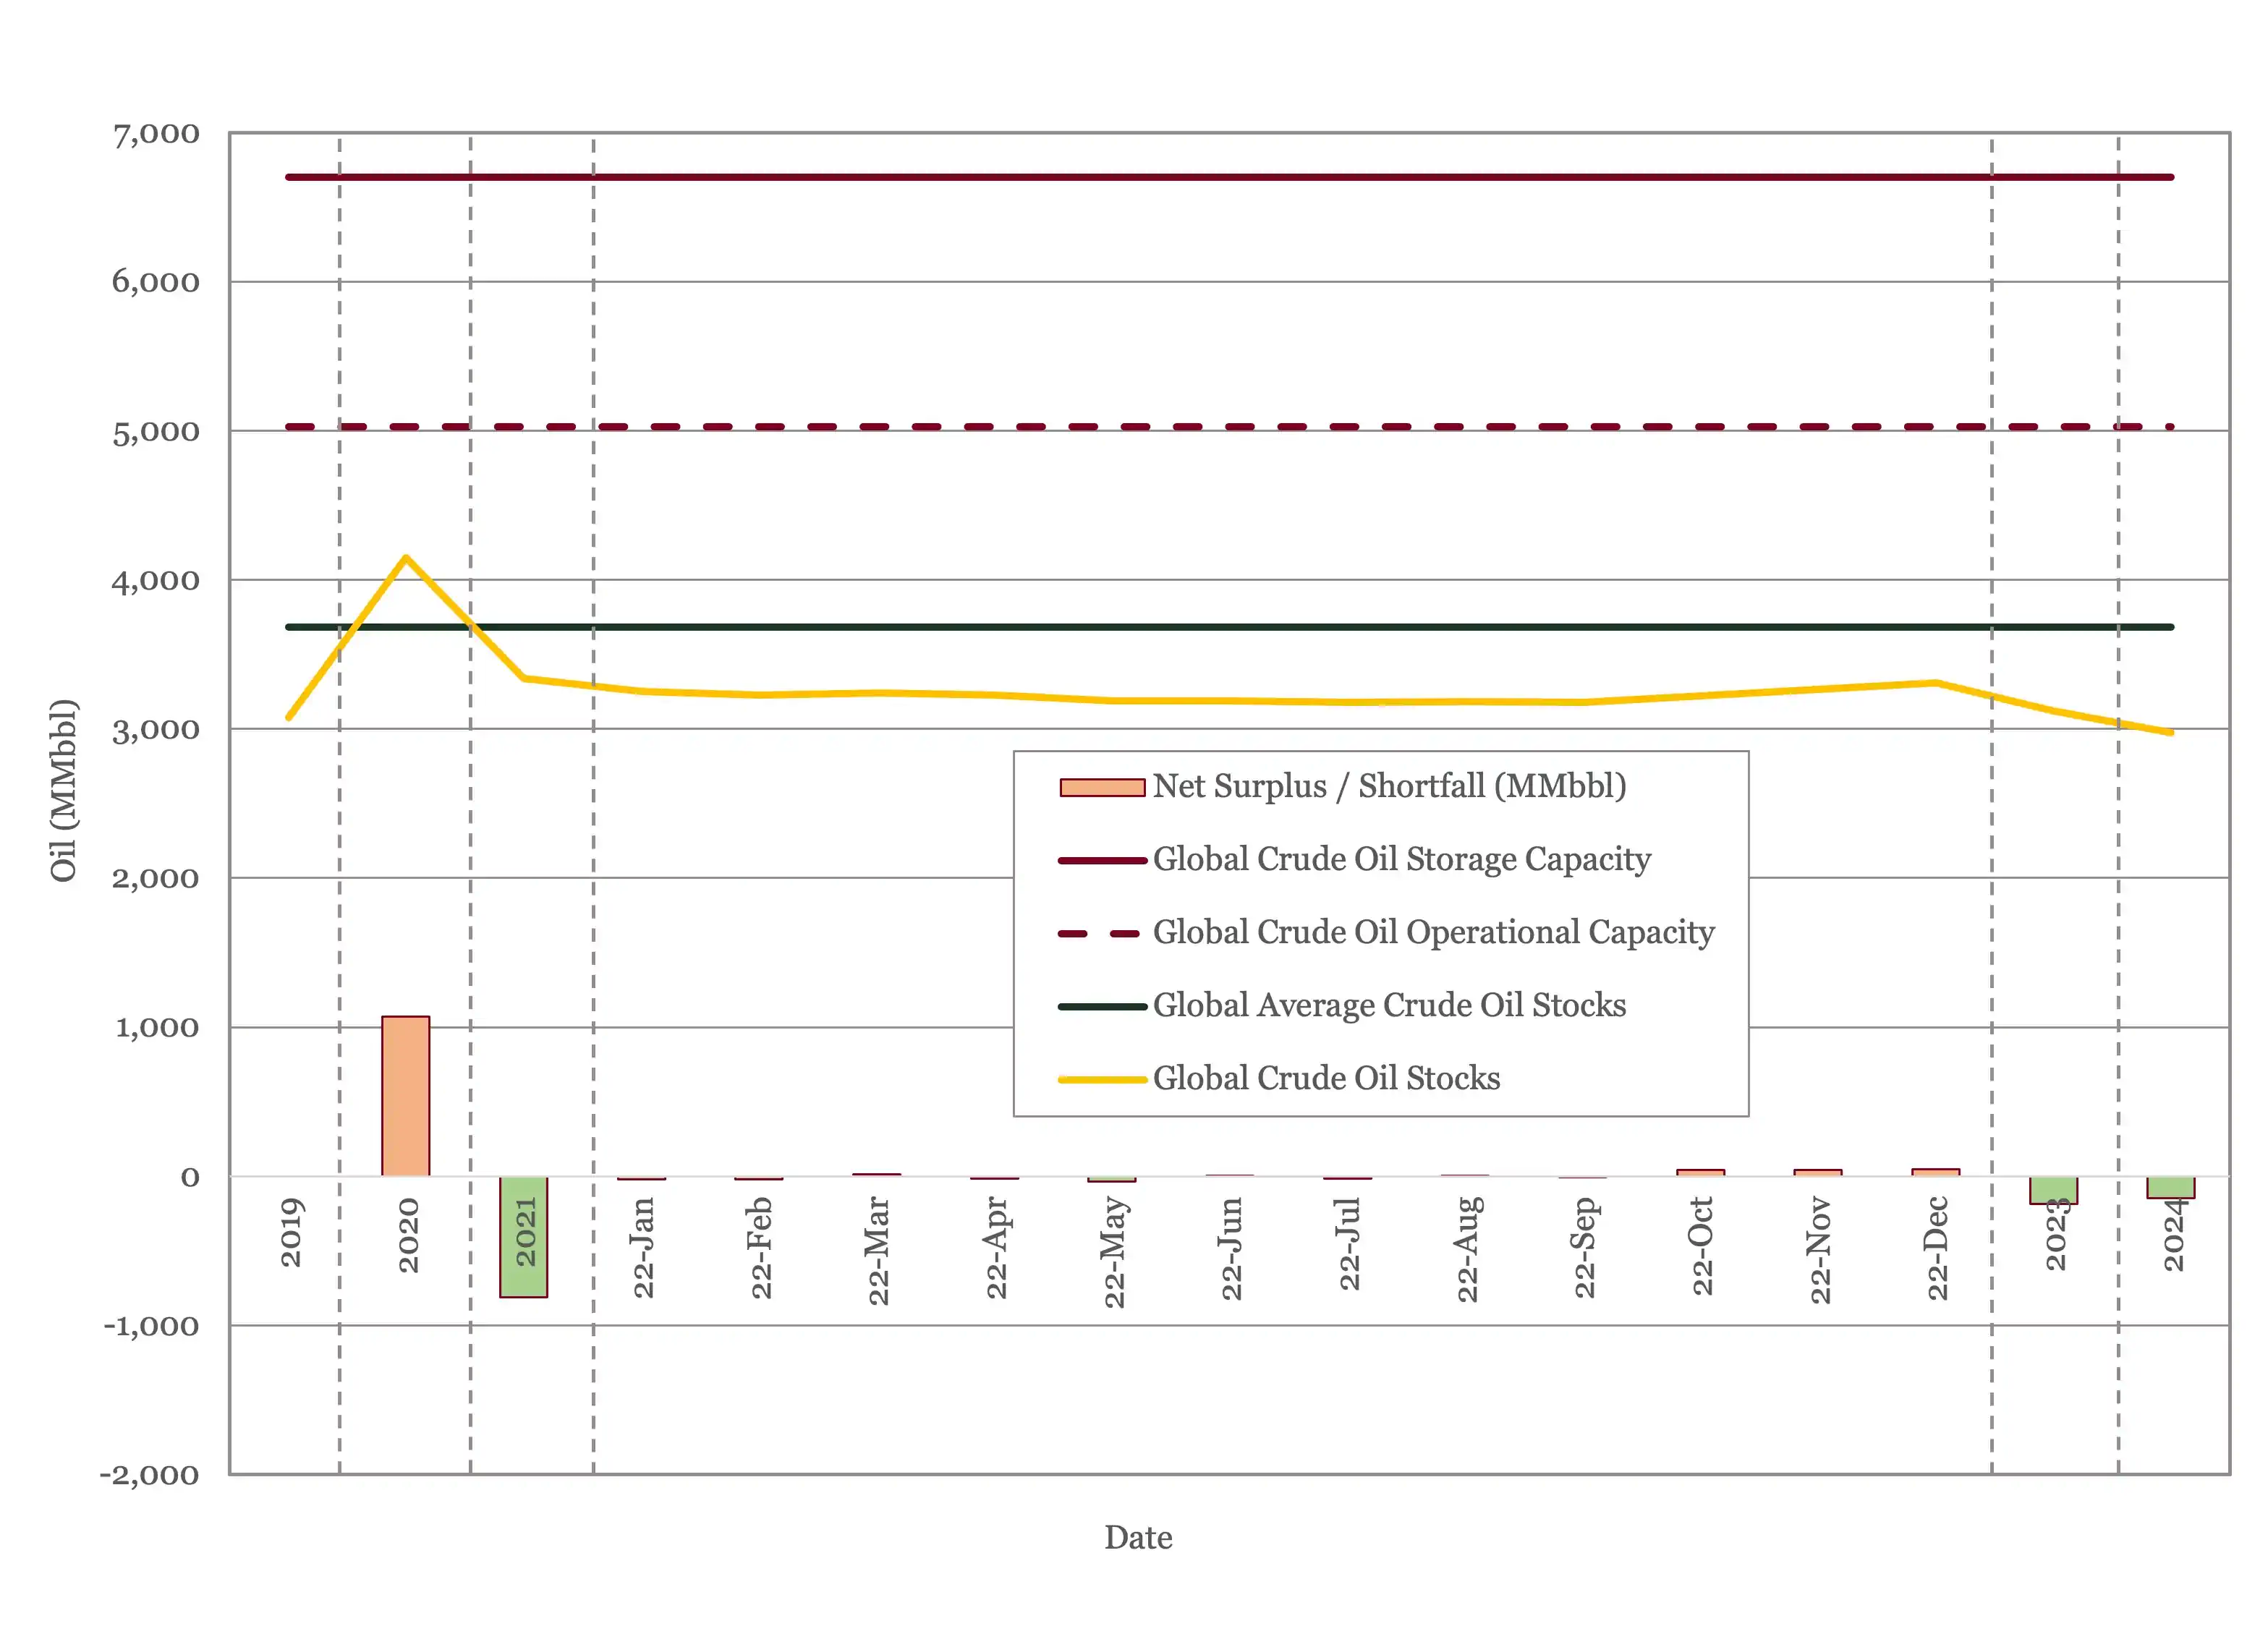
Figure 2 - Global Storage Chart
Oil Prices
Crude oil dipped under the $100/bbl mark in July and has been drifting downward ever since. It has been bouncing around $85/bbl so far this month, a level which will continue to provide the industry with healthy margins. Both Brent and WTI futures are down again this month, with Brent falling under $70/bbl in 2027 and WTI breaking through the same level in 2025.
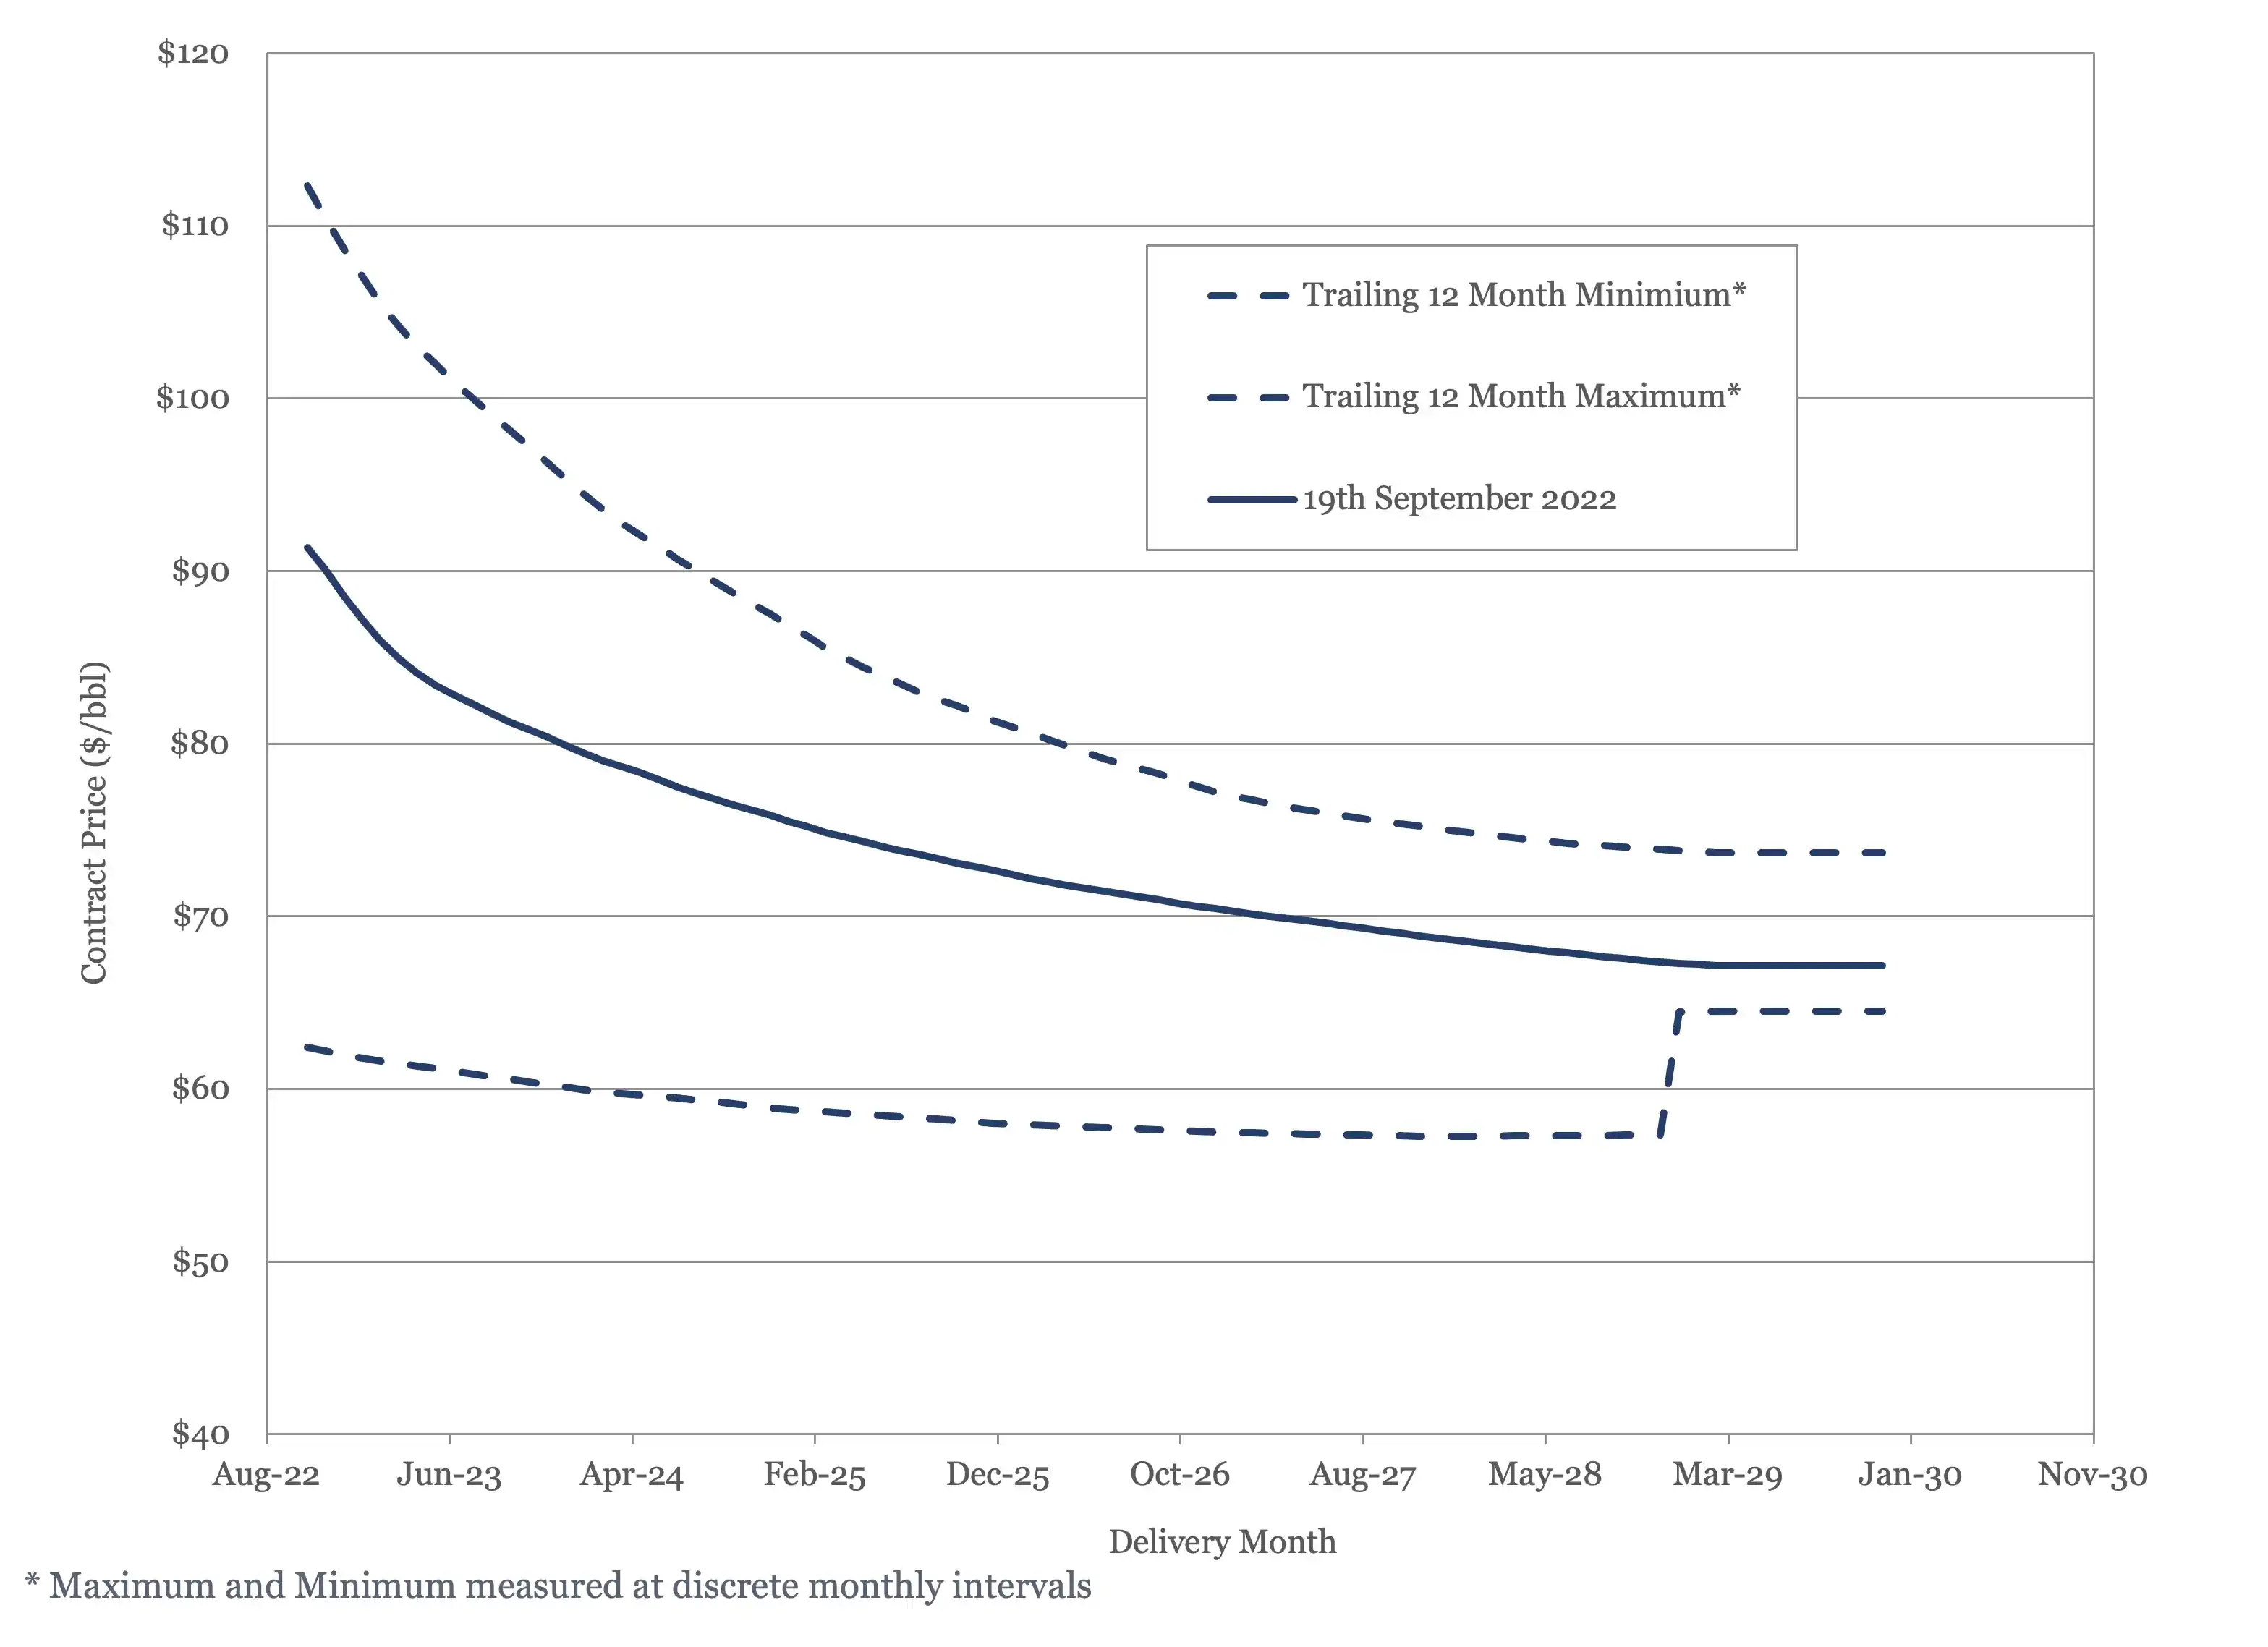
Figure 3 - Brent Crude Oil Futures

Figure 4 - WTI Crude Oil Futures
The present supply and demand balance doesn’t seem to justify current oil price levels. Stocks are below the 5 – year average, so there is an argument to support prices about the long-term average, but not at the $100/bbl and above level. Conversely, the outlook through 2025 is for the market to tighten, which should dictate rising prices over that period. This suggests we should see a normal, rather than an inverted, futures curve.
US Activity
The US land oil rig count seems to have leveled off over the last couple of months, hitting 586 on the 29th of July and 29th August, before falling back into the 570s. This has reignited the debate about how much activity the US domestic industry can support and what is limiting it – investor sentiment, inventory, services costs, or rig availability. The Wall Street Journal (5) recently reported that it is investors, specifically investors in public oil and gas companies, who are setting the ceiling, with the privately held oil companies having expanded as far as they are able. This reading is consistent with prior Dallas Federal Reserve surveys, which identified capital constraints as the limiting factor.

Figure 5 - US Land Oil Rig Count
(1) Oil Market Report – September 14th, 2022, IEA, Paris.
(2) Short Term Energy Outlook (STEO), September 7th, 2022, U.S. Energy Information Administration.
(3) “OPEC Monthly Oil Market Report”, Organization of the Petroleum Exporting Countries, September 13th, 2022.
(4) 32nd OPEC and non-OPEC Ministerial Meeting, September 5th, 2022.
(5) “Private Oil Drillers Are Hitting Their Limits”, Collin Eaton and Benoît Morenne, The Wall Street Journal, September 19th, 2022.


Explore Our Services

Business Development
Oil & Gas an extractive industry, participants must continuously find and develop new oil & gas fields as existing fields decline, making business development a continuous process.

Strategy
We approach strategy through a scenario driven assessment of the client’s current portfolio, organizational competencies, and financial framework. The strategy defines portfolio actions and coveted asset attributes.
Origination
Deal origination consists of identifying coveted assets, assets with attributes consistent with the client’s strategy, and qualified buyers. We advocate a proactive approach to business development and will undertake outreach on our client’s behalf.
Transaction Support
Transaction support consists of in depth asset evaluation, negotiation of commercial agreements or preparation of license round submission and close out of conditions. We can also aid in joint venture set up and management and asset maturation as required.