Oil Market Forecast - February 2021
Summary
This February edition of our Oil Market Forecast comes directly after winter storm Uri brought freezing temperatures and power cuts across Texas, in some cases for multiple days. Beyond associated gas from oil production, oil doesn’t contribute to the power supply in Texas. However, the events of last week underscore how critical a reliable energy supply is, and how devastating the impact can be when it is interrupted.
Prior to winter storm Uri, there was extensive media coverage of the acceleration in electric vehicle adoption and so in this edition we start by examining forecasts for electric vehicle sales and their impact on oil demand. We then move on to our normal update of global crude oil supply and demand, storage, spot and futures market pricing and US onshore rig activity levels.
A few key points:
- Deloitte has forecast that electrical vehicle sales will grow to 32% of overall vehicle sales by 2030.
- Our model predicts that the installed vehicle base will still consist of 92% internal combustion engine vehicles by 2030.
- Our model predicts that the installed electrical vehicle base will fall short of International Energy Agency (IEA) assumptions by 2030 under both its ‘Stated Policies’ and ‘Sustainable Development’ scenarios. This implies oil demand will be higher than the IEA predicts through the rest of this decade.
- Based on these conclusions, it seems premature to abandon the manufacture of internal combustion engine vehicles, production of crude oil or refining of crude into gasoline and diesel.
- Under current assumptions, the oil market returns to oversupply in the spring of 2021 flips to a supply deficit in 2022 which widens in 2023 and beyond.
- Estimates of global crude stocks in 2021 support a further extension of OPEC+ production curbs through the second half of 2021.
- Brent crude futures are now above $50/bbl through 2028 and WTI futures are above $50/bbl for the rest of the year.
- US land oil rig counts have continued to rise, an increase which is expected to continue, albeit at a slower rate, for the rest of the year.
Electric Vehicle Adoption
There has been a lot of coverage of electrical vehicle adoption leading to the demise of gasoline and diesel over the course of the last month. At the beginning of February, Adam Jonas, an analyst with Morgan Stanley, was reported (1) as saying that the market may be ascribing zero or negative value to the car manufactures internal combustion engine assets.
As of February 4th, 2021, Tesla was valued at $810 billion, the fifth most valuable company in the S&P 500 (2) and worth more than the next seven most valuable car manufacturers combined. General Motors, which would be worth more than $4 trillion if it was valued on the same vehicle sales to market capitalization ratio as Tesla, announced that it aspired to a target of phasing out all internal combustion engine vehicles from its line up by 2035 (3).
Oil is used primarily for petrochemicals and transportation, so in thinking about long term oil demand, the likely trajectory of internal combustion engine (ICE) and electric vehicle (EV) sales is certainly worth spending some time on. Some prior editions of this oil market forecast, published at the end of last year, considered long term demand forecasts. This series was compiled into a paper, published by the Petroleum Economist (4). The paper concluded that that the IEA ‘Stated Policies’ or OPEC long term oil demand looked most likely.
As noted in that paper, one of the issues in assessing these forecasts is that the underlying assumptions aren’t articulated. We are fortunate when it comes to the question of EV penetration, as the IEA does explicitly link the EV installed base with its two scenarios - the IEA’s ‘Stated Polices’ and ‘Sustainable Development’ scenarios as shown in Figure 1. The ‘Stated Policies’ scenario is intended to reflect oil demand under current policies and shows demand rising slowly through 2030, reaching just over104 MMbbl/day, and maintaining this level through to 2040. The IEA’s ‘Sustainable Development’ scenario is intended to reflect oil demand in a world where global warming is limited to 2 degrees centigrade above pre-industrial levels. This sees oil demand falling from 2019 to just under 70 MMbbl/day by 2040.

Figure 1 - IEA Long Term Oil Demand Forecasts
The total installed base of EVs under each of the IEAs’ scenarios (5) is shown in Figure 2. Under the ‘Stated Policies’ scenario, these reach 138 million vehicles in 2030, while under the ‘Sustainable Development’ scenario, these reach 244 million vehicles by 2030. The IEA includes battery and plug in hybrid cars, trucks, and buses under their definition, but excludes two and three wheeled vehicles.

Figure 2 - IEA Total Installed Electric Vehicle Base
The author was unable to find any publicly available forecasts of the installed base of EVs but was able to find historical data on sales and EV and ICE installed bases, and projections of future sales. Historical sales data (6), (7), (8) and sales projections (9) for each vehicle type is shown in Figure 3. As this shows, ICE sales peaked in 2017 and have been declining ever since, with a particularly sharp drop in 2020. EV sales have been rising from zero less than a decade ago, and while they flatlined in 2020, they did not fall back. Deloitte predicts that ICE sales will grow at 3% per annum through to 2025, before declining at 3% per annum to 2030. It predicts EV sales will grow at 35% year on year through 2025, before slowing to 23% growth per annum through to 2030. By 2030, Deloitte predicts that 30% of all global vehicle sales will be EVs.

Figure 3 - Annual Global Vehicle Sales (2005-2020) and Deloitte Forecast to 2030
The installed base (5), (10) of each vehicle type is shown in Figure 4. While EV sales growth has been rising, as of 2020 they only had an installed base of 10 million vehicles, as opposed to 1,320 million ICEs. The installed ICE base continued to grow through 2020, despite the fall in sales.
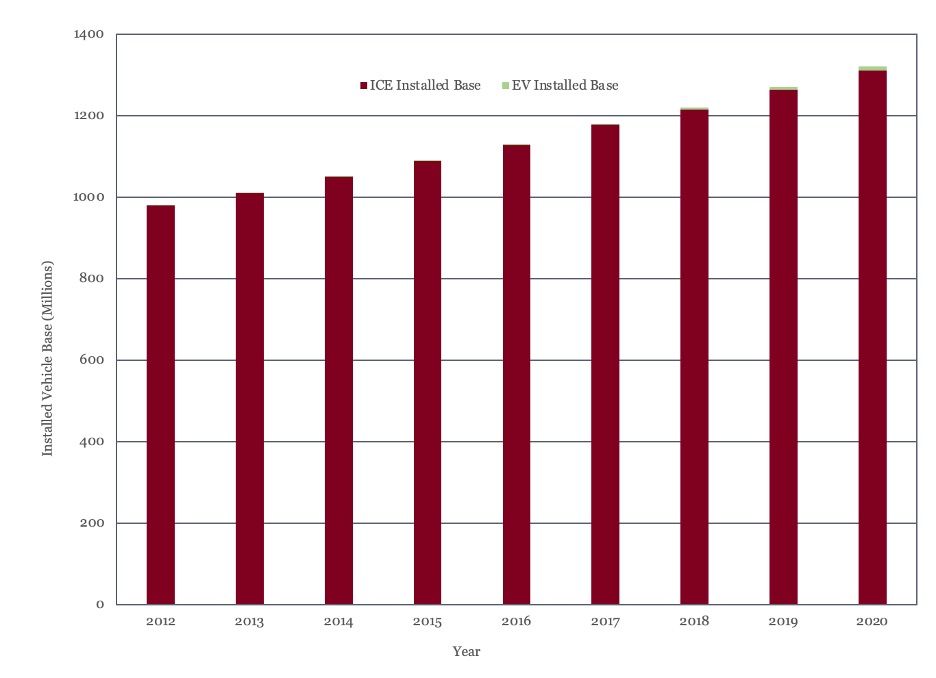
Figure 4 - Installed Base of ICE and EV Vehicles
Linear regression on the ICE and EV datasets showed a strong relationship between historical sales and installed vehicle base (R2>99% in both cases), as would be expected. These relationships were then used to predict the installed base on both ICE’s and EV’s through 2030. This prediction is shown in Figure 5.

Figure 5 - ICE and EV Installed Base Forecast
As Figure 5 shows, the model predicts a drop in the installed ICE base over the next few years. This reflects the fall in ICE sales since 2017 and can be expected to have an impact on oil demand over the near term. In general, though, the model shows the ICE base will fluctuate between 1,100 and 1,200 million units for the rest of the decade. The model also shows that while the EV base continues to grow, it will still only constitute 95 million vehicles, or 8% of all vehicles, by 2030.
Returning to the IEA scenario assumptions, the installed EV base, based on the Deloitte forecast and this model, would fall some way short of the installed base required for either the ‘Stated Policies’ or ‘Sustainable Development’ scenarios. See Figure 6.

Figure 6 - Glenloch Energy Forecast and IEA Scenario Installed EV Base
The Deloitte sales forecast shown in Figure 3 serves to undermine the argument that ICE manufacturing capacity has no or negative value, as they predict that 70% of vehicle sales will still be ICEs in 2030.
The second conclusion that can be drawn from the modelling work here concerns the impact of EV adoption on long term oil demand. The lower EV base predicted here implies that oil demand in 2030 will be 0.6 MMbbl/day higher than under the IEA ‘Stated Policies’ scenario.
Based on these conclusions, it seems premature to abandon either ICE manufacturing, production of crude oil or refining of crude into gasoline and diesel.
Oil Supply and Demand
The last month has also seen some welcome news on the COVID-19 front. Progress is being made with vaccination and rates of new infection, in the United States at least, have started to fall dramatically. There seems to be some cause for renewed optimism, with some medical experts predicting that the US will have achieved herd immunity by April, through a combination of natural immunity and vaccination (11).
This positive outlook has yet to feed into oil demand estimates. Demand estimates from the latest IEA report (12) show a further decline of 0.4 MMbbl/day for the first quarter of 2021, with demand now estimated at 93.9 MMbbl/day for the first quarter and 96.4 MMbbl/day for the full year. The latest EIA report (13) has cut 0.1 MMbbl/day from its demand estimate for 2021, with current estimates at 97.7 MMbbl/day, but projects a rebound to 101.2 MMbbl/day, regaining (EIA) 2019 levels, in 2022. OPEC’s latest estimate (14) has raised 2021 oil demand slightly to 96.1 MMbbl/day.
New supply data is in line with last month’s forecast. The latest EIA data for November showed US oil production rising to 16.4 MMbbl/day from 15.7 MMbbl/day in October.
We expect US production to average 16.5 MMbbl/day for 2020 and 15.8 MMbbl/day for 2021, down its 2019 average of 17.2 MMbbl/day. Our long term supply forecast does not see US production reaching 2019 levels again within the forecast period, which runs to 2035. The US onshore oil rig count continues to grow, reaching 288 units as of this report.
We expect supply to average 93.5 MMbbl/day through the first quarter of the year against average demand of 93.9 MMbbl/day, with oil market remaining in deficit for the first four months of 2021, as shown in Figure 7. May 2021 sees a steep jump in production as all OPEC and non-OPEC supply agreements expire, with the market then returning to deficit in 2022 and beyond.
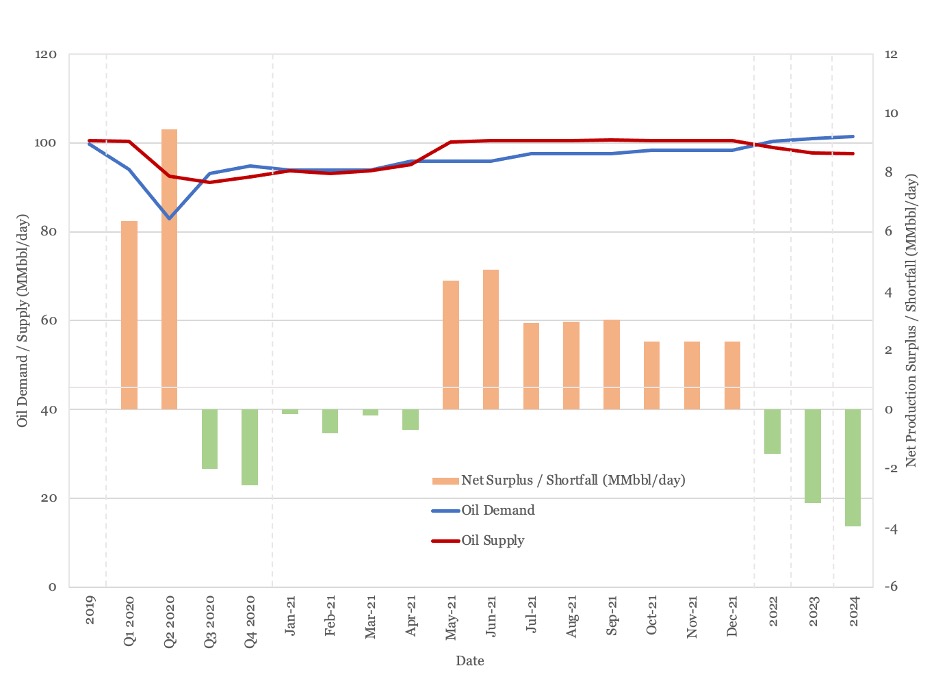
Figure 7 - Supply and Demand and Surplus Forecast
Even with the committed OPEC+ supply curbs, the market is expected to be in surplus for 2021 and in slight deficit in 2022 before moving into a sharp supply deficit in 2023 and beyond. OPEC have indicated they will continue to meet monthly and phase out production cuts as the market recovers. For all the recent rise in oil prices, oil market balance remains very much an OPEC+ gift.
Oil Storage
We estimate global oil inventory drawdowns at 186 million barrels and 238 million barrels in the third and fourth quarter of 2020 respectively. While this may appear a large draw, it comes after an inventory build of 1.4 billion barrels in the first half of the year. Draws are forecast to continue at an average of 14 MMbbl/month for the first four months of 2021, as the OPEC+ supply curbs restrict supply and demand recovers.
Figure 8 shows global storage capacity and inventories. Global inventories peaked in May at 4.6 billion barrels, nearly half a billion barrels short of the estimated operational limit on global storage. They are expected to decline to just over 4 billion barrels by April 2021 and then start to build again from the spring, back to 4.8 billion barrels by year end. From there, they are expected to fall sharply as recovering demand outstrips supply.

Figure 8 - Global Oil Storage Chart
As Figure 8 shows, the market will require an extension of existing OPEC+ production curbs to prevent supply building back to last year’s peaks by the end of the year. There is also an increasingly urgent need invest in additional production capacity to safeguard supply beyond 2022, something that OPEC+ action could encourage if a tighter market yielded higher prices.
Oil Prices
While oil market balance remains in the gift of OPEC, oil prices have maintained the recovery that began at the end of last year. WTI passed $60/bbl last week during the winter storm Uri and has bounced back above that level again as of this report. Brent crude passed $60/bbl on February 8th.
The Brent futures contract remains inverted and the WTI futures contract remains inverted through the middle of the decade and normal beyond that, see Figure 9. Both curves have shifted sharply upward over the last month, with WTI up by an average of $3.20 across all contracted delivery dates. The Brent curve is now above $50/bbl through 2028. The WTI futures contract remains above $50 for the remainder of 2020.

Figure 9 - Brent and WTI Crude Oil Futures
As highlighted in the supply and demand and storage sections of this report, while the recovery in pricing provides some welcome relief to producers it should remembered that this price recovery is built on OPEC+ supply restraint, rather than fundamental supply and demand capacity. A failure to extend OPEC plus supply restraints from May is likely to result in a sharp deterioration in spot prices.
US Activity
The US land oil rig count closed 2020 at 248 units, having started the year at 648 and hitting a low of 158 in August. Land oil rig counts have continued their recovery into 2021, rising to 288 as of the 19th of February.
The consensus seems to be that the outlook for 2021 is a bit better than 2020, but not much. WTI crossed the $50 per barrel mark on the 6th of January and has managed to keep its head above that waterline since then. However, it is worth noting that while the spot price is above $50 and there is reason to believe prices could rise through the year, around half of US oil production is hedged in the low 40’s. This, together with the need to repair balance sheets and return cash to investors, is likely to limit scope for investment for the rest of the year.
Estimates for 2021 US onshore activity range between 8,000 and 9,000 new wells for the year, against an estimated 7,400 for 2020. This equates to an average rig count of between 340 and 380 for the year, set against an average rig count of 329 for 2020. Historic and forecast rig counts are shown in Figure 10.

Figure 10 - US Land Oil Rig Count
(1) "Morgan Stanley: Gasoline Industry Is About to Become Totally Worthless", Oilprice.com, February 10th 2021.
(2) "Market capitalization of largest companies in S&P 500 Index as of February 4th, 2021", Statista
(3) "GM to Phase Out Gas- and Diesel-Powered Vehicles by 2035", Wall Street Journal, January 28th 2021.
(4) "Oil Demand Through The Energy Transition", Glenloch Energy, January 2021
(5) IEA (2020), Global EV Outlook 2020, IEA, Paris
(6) IEA, Global car sales by key markets, 2005-2020, IEA, Paris
(7) McKinsey Electric Vehicle Index: Europe cushions a global plunge in EV sales, McKinsey & Company, July 17th 2020
(8) Electric Vehicles in 2013: a Progress Report, Transport and Environment, July 2014.
(9) Electric Vehicles: Setting a course for 2030, Deloitte Insights, 28th July 2020
(10) The road to 2020 and beyond: What’s driving the global automotive industry?, McKinsey & Company, August 2013.
(11) "We’ll Have Herd Immunity by April", Wall Street Journal, February 18th 2021
(12) IEA (2021), Oil Market Report - February 2021, IEA, Paris
(13) Short Term Energy Outlook, EIA, (th February 2021
(14) “OPEC Monthly Oil Market Report”, February 11th, 2021, Organization of the Petroleum Exporting Countries


Oil Market Forecast - February 2021
Summary
This February edition of our Oil Market Forecast comes directly after winter storm Uri brought freezing temperatures and power cuts across Texas, in some cases for multiple days. Beyond associated gas from oil production, oil doesn’t contribute to the power supply in Texas. However, the events of last week underscore how critical a reliable energy supply is, and how devastating the impact can be when it is interrupted.
Prior to winter storm Uri, there was extensive media coverage of the acceleration in electric vehicle adoption and so in this edition we start by examining forecasts for electric vehicle sales and their impact on oil demand. We then move on to our normal update of global crude oil supply and demand, storage, spot and futures market pricing and US onshore rig activity levels.
A few key points:
- Deloitte has forecast that electrical vehicle sales will grow to 32% of overall vehicle sales by 2030.
- Our model predicts that the installed vehicle base will still consist of 92% internal combustion engine vehicles by 2030.
- Our model predicts that the installed electrical vehicle base will fall short of International Energy Agency (IEA) assumptions by 2030 under both its ‘Stated Policies’ and ‘Sustainable Development’ scenarios. This implies oil demand will be higher than the IEA predicts through the rest of this decade.
- Based on these conclusions, it seems premature to abandon the manufacture of internal combustion engine vehicles, production of crude oil or refining of crude into gasoline and diesel.
- Under current assumptions, the oil market returns to oversupply in the spring of 2021 flips to a supply deficit in 2022 which widens in 2023 and beyond.
- Estimates of global crude stocks in 2021 support a further extension of OPEC+ production curbs through the second half of 2021.
- Brent crude futures are now above $50/bbl through 2028 and WTI futures are above $50/bbl for the rest of the year.
- US land oil rig counts have continued to rise, an increase which is expected to continue, albeit at a slower rate, for the rest of the year.
Electric Vehicle Adoption
There has been a lot of coverage of electrical vehicle adoption leading to the demise of gasoline and diesel over the course of the last month. At the beginning of February, Adam Jonas, an analyst with Morgan Stanley, was reported (1) as saying that the market may be ascribing zero or negative value to the car manufactures internal combustion engine assets.
As of February 4th, 2021, Tesla was valued at $810 billion, the fifth most valuable company in the S&P 500 (2) and worth more than the next seven most valuable car manufacturers combined. General Motors, which would be worth more than $4 trillion if it was valued on the same vehicle sales to market capitalization ratio as Tesla, announced that it aspired to a target of phasing out all internal combustion engine vehicles from its line up by 2035 (3).
Oil is used primarily for petrochemicals and transportation, so in thinking about long term oil demand, the likely trajectory of internal combustion engine (ICE) and electric vehicle (EV) sales is certainly worth spending some time on. Some prior editions of this oil market forecast, published at the end of last year, considered long term demand forecasts. This series was compiled into a paper, published by the Petroleum Economist (4). The paper concluded that that the IEA ‘Stated Policies’ or OPEC long term oil demand looked most likely.
As noted in that paper, one of the issues in assessing these forecasts is that the underlying assumptions aren’t articulated. We are fortunate when it comes to the question of EV penetration, as the IEA does explicitly link the EV installed base with its two scenarios - the IEA’s ‘Stated Polices’ and ‘Sustainable Development’ scenarios as shown in Figure 1. The ‘Stated Policies’ scenario is intended to reflect oil demand under current policies and shows demand rising slowly through 2030, reaching just over104 MMbbl/day, and maintaining this level through to 2040. The IEA’s ‘Sustainable Development’ scenario is intended to reflect oil demand in a world where global warming is limited to 2 degrees centigrade above pre-industrial levels. This sees oil demand falling from 2019 to just under 70 MMbbl/day by 2040.
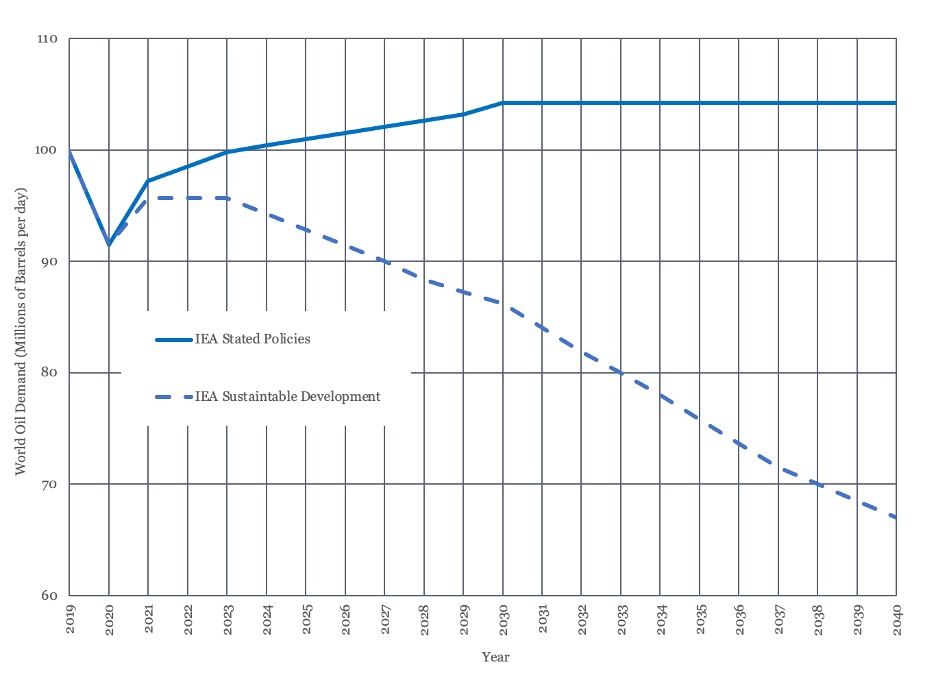
Figure 1 - IEA Long Term Oil Demand Forecasts
The total installed base of EVs under each of the IEAs’ scenarios (5) is shown in Figure 2. Under the ‘Stated Policies’ scenario, these reach 138 million vehicles in 2030, while under the ‘Sustainable Development’ scenario, these reach 244 million vehicles by 2030. The IEA includes battery and plug in hybrid cars, trucks, and buses under their definition, but excludes two and three wheeled vehicles.
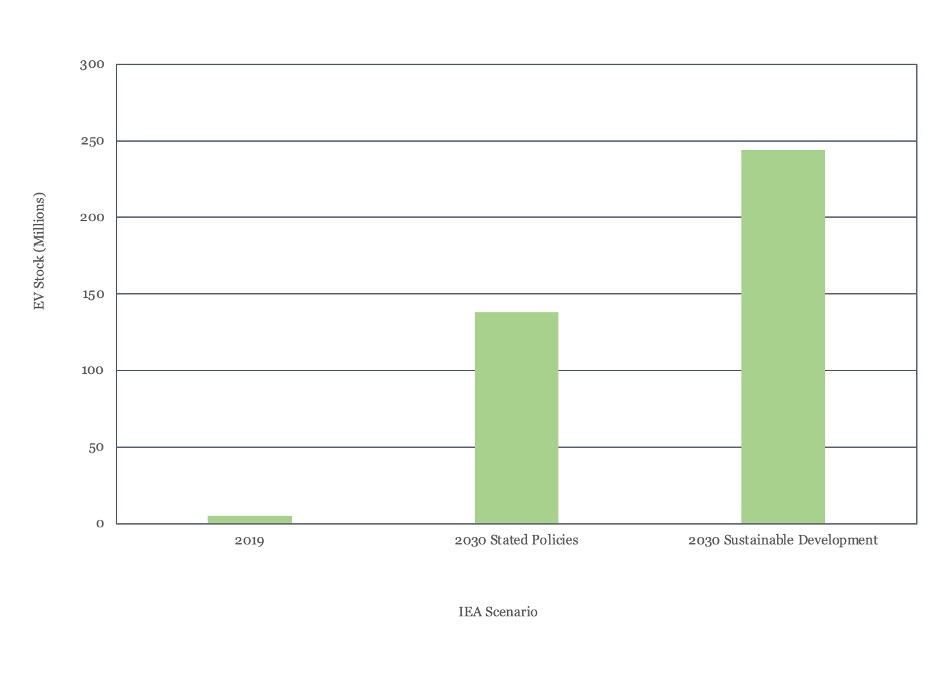
Figure 2 - IEA Total Installed Electric Vehicle Base
The author was unable to find any publicly available forecasts of the installed base of EVs but was able to find historical data on sales and EV and ICE installed bases, and projections of future sales. Historical sales data (6), (7), (8) and sales projections (9) for each vehicle type is shown in Figure 3. As this shows, ICE sales peaked in 2017 and have been declining ever since, with a particularly sharp drop in 2020. EV sales have been rising from zero less than a decade ago, and while they flatlined in 2020, they did not fall back. Deloitte predicts that ICE sales will grow at 3% per annum through to 2025, before declining at 3% per annum to 2030. It predicts EV sales will grow at 35% year on year through 2025, before slowing to 23% growth per annum through to 2030. By 2030, Deloitte predicts that 30% of all global vehicle sales will be EVs.
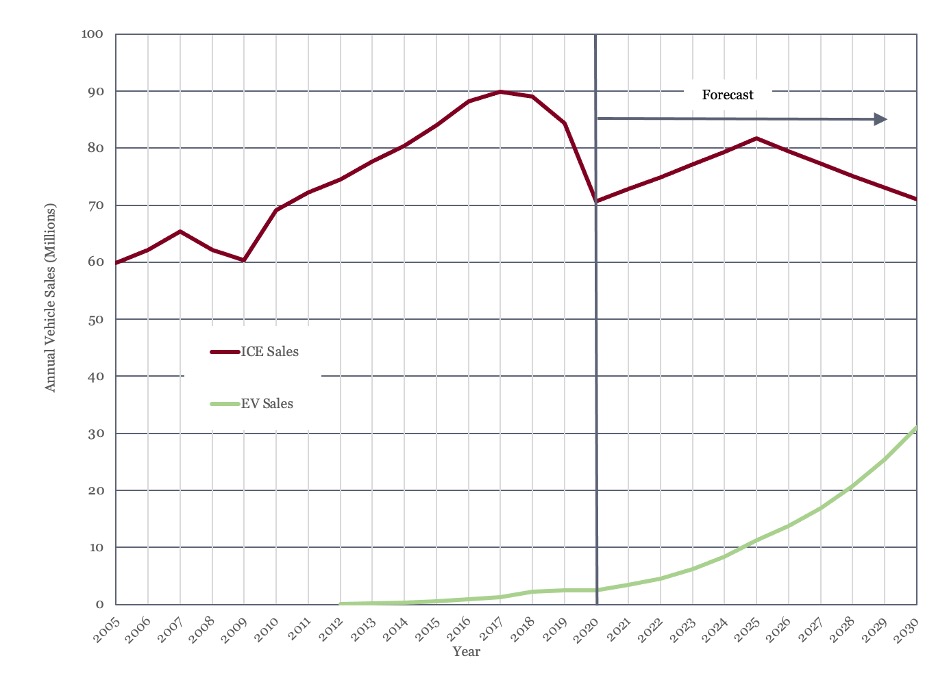
Figure 3 - Annual Global Vehicle Sales (2005-2020) and Deloitte Forecast to 2030
The installed base (5), (10) of each vehicle type is shown in Figure 4. While EV sales growth has been rising, as of 2020 they only had an installed base of 10 million vehicles, as opposed to 1,320 million ICEs. The installed ICE base continued to grow through 2020, despite the fall in sales.

Figure 4 - Installed Base of ICE and EV Vehicles
Linear regression on the ICE and EV datasets showed a strong relationship between historical sales and installed vehicle base (R2>99% in both cases), as would be expected. These relationships were then used to predict the installed base on both ICE’s and EV’s through 2030. This prediction is shown in Figure 5.
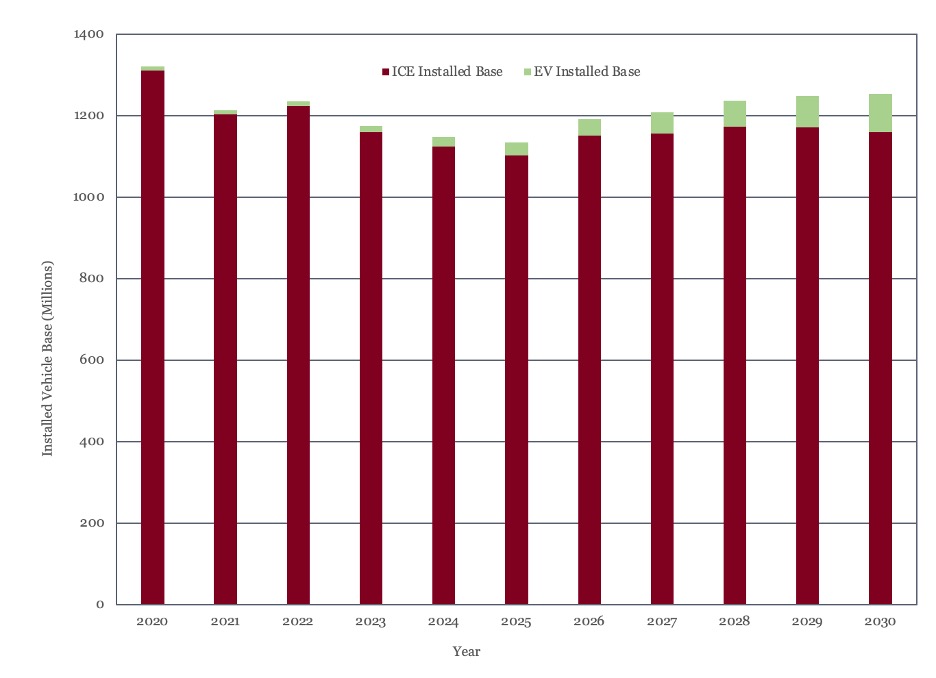
Figure 5 - ICE and EV Installed Base Forecast
As Figure 5 shows, the model predicts a drop in the installed ICE base over the next few years. This reflects the fall in ICE sales since 2017 and can be expected to have an impact on oil demand over the near term. In general, though, the model shows the ICE base will fluctuate between 1,100 and 1,200 million units for the rest of the decade. The model also shows that while the EV base continues to grow, it will still only constitute 95 million vehicles, or 8% of all vehicles, by 2030.
Returning to the IEA scenario assumptions, the installed EV base, based on the Deloitte forecast and this model, would fall some way short of the installed base required for either the ‘Stated Policies’ or ‘Sustainable Development’ scenarios. See Figure 6.
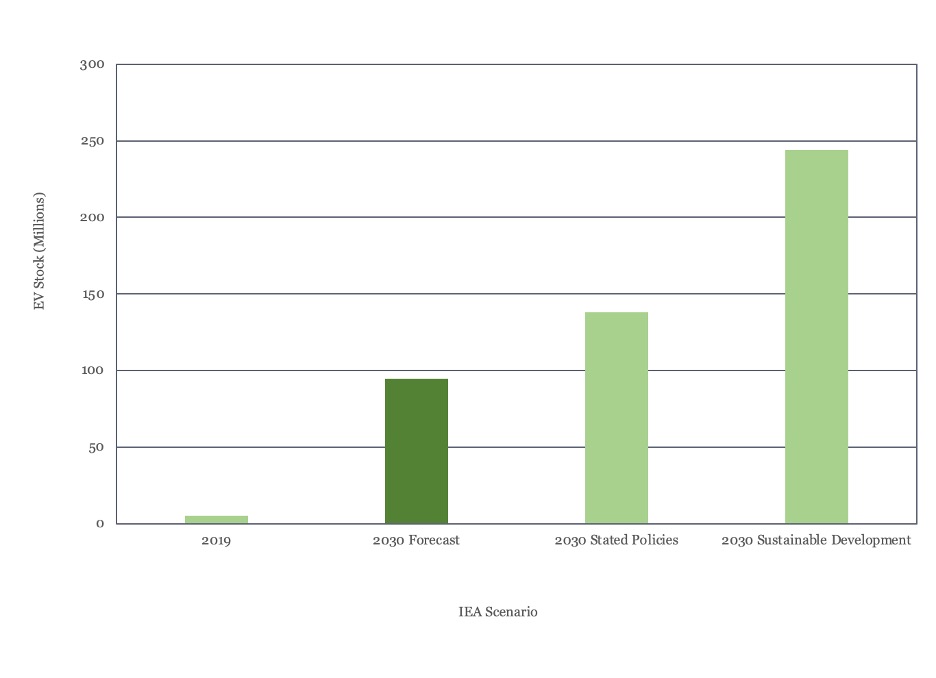
Figure 6 - Glenloch Energy Forecast and IEA Scenario Installed EV Base
The Deloitte sales forecast shown in Figure 3 serves to undermine the argument that ICE manufacturing capacity has no or negative value, as they predict that 70% of vehicle sales will still be ICEs in 2030.
The second conclusion that can be drawn from the modelling work here concerns the impact of EV adoption on long term oil demand. The lower EV base predicted here implies that oil demand in 2030 will be 0.6 MMbbl/day higher than under the IEA ‘Stated Policies’ scenario.
Based on these conclusions, it seems premature to abandon either ICE manufacturing, production of crude oil or refining of crude into gasoline and diesel.
Oil Supply and Demand
The last month has also seen some welcome news on the COVID-19 front. Progress is being made with vaccination and rates of new infection, in the United States at least, have started to fall dramatically. There seems to be some cause for renewed optimism, with some medical experts predicting that the US will have achieved herd immunity by April, through a combination of natural immunity and vaccination (11).
This positive outlook has yet to feed into oil demand estimates. Demand estimates from the latest IEA report (12) show a further decline of 0.4 MMbbl/day for the first quarter of 2021, with demand now estimated at 93.9 MMbbl/day for the first quarter and 96.4 MMbbl/day for the full year. The latest EIA report (13) has cut 0.1 MMbbl/day from its demand estimate for 2021, with current estimates at 97.7 MMbbl/day, but projects a rebound to 101.2 MMbbl/day, regaining (EIA) 2019 levels, in 2022. OPEC’s latest estimate (14) has raised 2021 oil demand slightly to 96.1 MMbbl/day.
New supply data is in line with last month’s forecast. The latest EIA data for November showed US oil production rising to 16.4 MMbbl/day from 15.7 MMbbl/day in October.
We expect US production to average 16.5 MMbbl/day for 2020 and 15.8 MMbbl/day for 2021, down its 2019 average of 17.2 MMbbl/day. Our long term supply forecast does not see US production reaching 2019 levels again within the forecast period, which runs to 2035. The US onshore oil rig count continues to grow, reaching 288 units as of this report.
We expect supply to average 93.5 MMbbl/day through the first quarter of the year against average demand of 93.9 MMbbl/day, with oil market remaining in deficit for the first four months of 2021, as shown in Figure 7. May 2021 sees a steep jump in production as all OPEC and non-OPEC supply agreements expire, with the market then returning to deficit in 2022 and beyond.

Figure 7 - Supply and Demand and Surplus Forecast
Even with the committed OPEC+ supply curbs, the market is expected to be in surplus for 2021 and in slight deficit in 2022 before moving into a sharp supply deficit in 2023 and beyond. OPEC have indicated they will continue to meet monthly and phase out production cuts as the market recovers. For all the recent rise in oil prices, oil market balance remains very much an OPEC+ gift.
Oil Storage
We estimate global oil inventory drawdowns at 186 million barrels and 238 million barrels in the third and fourth quarter of 2020 respectively. While this may appear a large draw, it comes after an inventory build of 1.4 billion barrels in the first half of the year. Draws are forecast to continue at an average of 14 MMbbl/month for the first four months of 2021, as the OPEC+ supply curbs restrict supply and demand recovers.
Figure 8 shows global storage capacity and inventories. Global inventories peaked in May at 4.6 billion barrels, nearly half a billion barrels short of the estimated operational limit on global storage. They are expected to decline to just over 4 billion barrels by April 2021 and then start to build again from the spring, back to 4.8 billion barrels by year end. From there, they are expected to fall sharply as recovering demand outstrips supply.
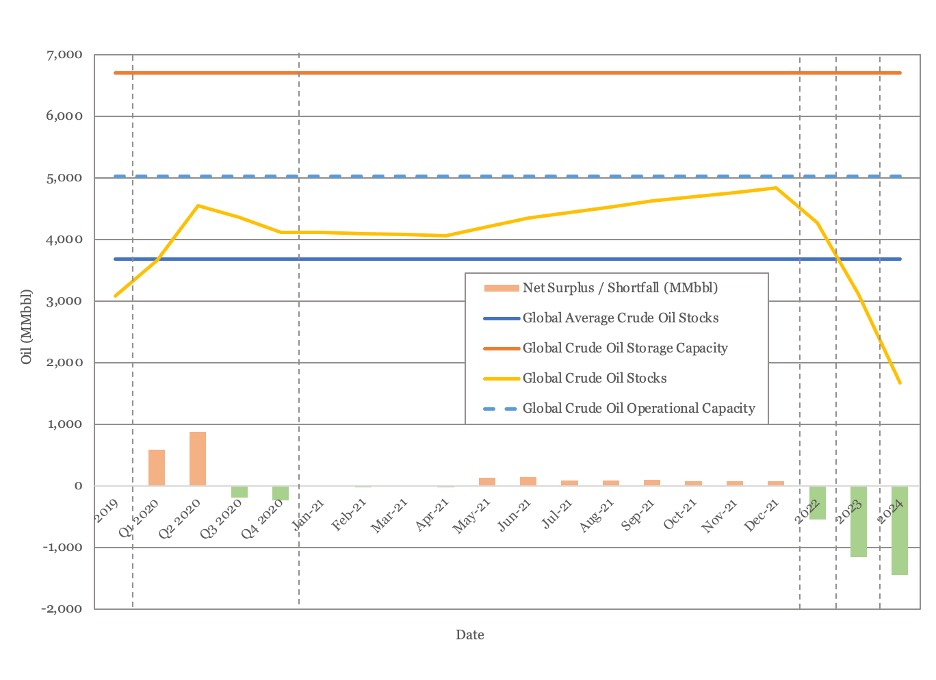
Figure 8 - Global Oil Storage Chart
As Figure 8 shows, the market will require an extension of existing OPEC+ production curbs to prevent supply building back to last year’s peaks by the end of the year. There is also an increasingly urgent need invest in additional production capacity to safeguard supply beyond 2022, something that OPEC+ action could encourage if a tighter market yielded higher prices.
Oil Prices
While oil market balance remains in the gift of OPEC, oil prices have maintained the recovery that began at the end of last year. WTI passed $60/bbl last week during the winter storm Uri and has bounced back above that level again as of this report. Brent crude passed $60/bbl on February 8th.
The Brent futures contract remains inverted and the WTI futures contract remains inverted through the middle of the decade and normal beyond that, see Figure 9. Both curves have shifted sharply upward over the last month, with WTI up by an average of $3.20 across all contracted delivery dates. The Brent curve is now above $50/bbl through 2028. The WTI futures contract remains above $50 for the remainder of 2020.
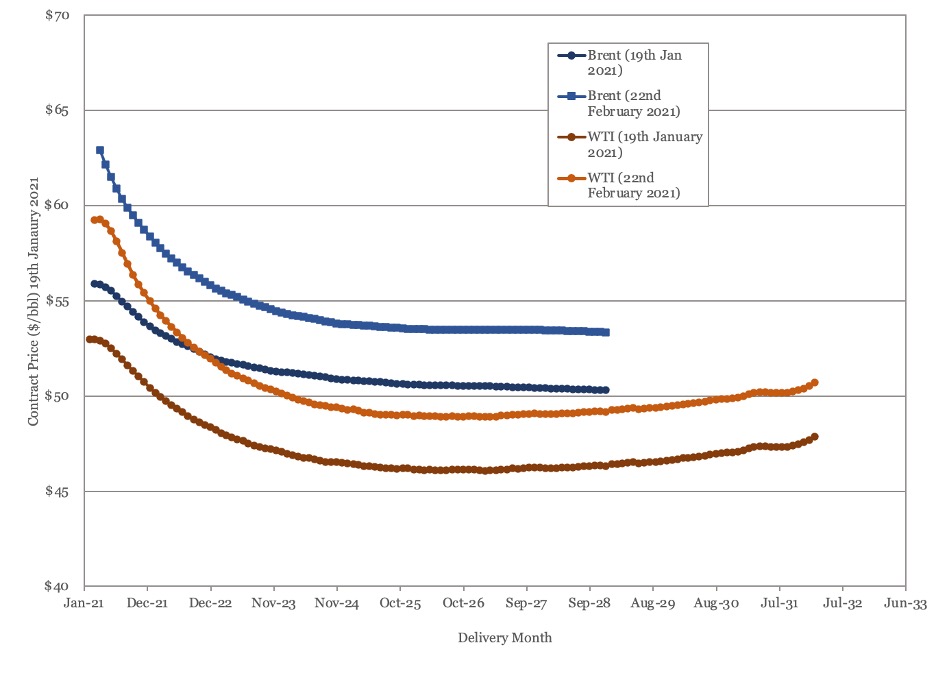
Figure 9 - Brent and WTI Crude Oil Futures
As highlighted in the supply and demand and storage sections of this report, while the recovery in pricing provides some welcome relief to producers it should remembered that this price recovery is built on OPEC+ supply restraint, rather than fundamental supply and demand capacity. A failure to extend OPEC plus supply restraints from May is likely to result in a sharp deterioration in spot prices.
US Activity
The US land oil rig count closed 2020 at 248 units, having started the year at 648 and hitting a low of 158 in August. Land oil rig counts have continued their recovery into 2021, rising to 288 as of the 19th of February.
The consensus seems to be that the outlook for 2021 is a bit better than 2020, but not much. WTI crossed the $50 per barrel mark on the 6th of January and has managed to keep its head above that waterline since then. However, it is worth noting that while the spot price is above $50 and there is reason to believe prices could rise through the year, around half of US oil production is hedged in the low 40’s. This, together with the need to repair balance sheets and return cash to investors, is likely to limit scope for investment for the rest of the year.
Estimates for 2021 US onshore activity range between 8,000 and 9,000 new wells for the year, against an estimated 7,400 for 2020. This equates to an average rig count of between 340 and 380 for the year, set against an average rig count of 329 for 2020. Historic and forecast rig counts are shown in Figure 10.
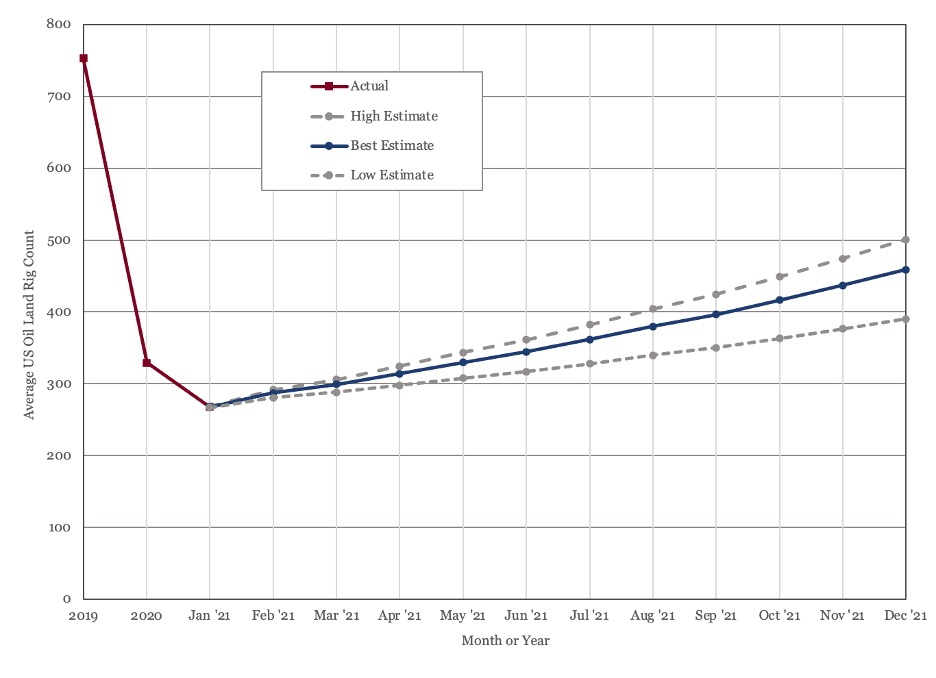
Figure 10 - US Land Oil Rig Count
(1) "Morgan Stanley: Gasoline Industry Is About to Become Totally Worthless", Oilprice.com, February 10th 2021.
(2) "Market capitalization of largest companies in S&P 500 Index as of February 4th, 2021", Statista
(3) "GM to Phase Out Gas- and Diesel-Powered Vehicles by 2035", Wall Street Journal, January 28th 2021.
(4) "Oil Demand Through The Energy Transition", Glenloch Energy, January 2021
(5) IEA (2020), Global EV Outlook 2020, IEA, Paris
(6) IEA, Global car sales by key markets, 2005-2020, IEA, Paris
(7) McKinsey Electric Vehicle Index: Europe cushions a global plunge in EV sales, McKinsey & Company, July 17th 2020
(8) Electric Vehicles in 2013: a Progress Report, Transport and Environment, July 2014.
(9) Electric Vehicles: Setting a course for 2030, Deloitte Insights, 28th July 2020
(10) The road to 2020 and beyond: What’s driving the global automotive industry?, McKinsey & Company, August 2013.
(11) "We’ll Have Herd Immunity by April", Wall Street Journal, February 18th 2021
(12) IEA (2021), Oil Market Report - February 2021, IEA, Paris
(13) Short Term Energy Outlook, EIA, (th February 2021
(14) “OPEC Monthly Oil Market Report”, February 11th, 2021, Organization of the Petroleum Exporting Countries


Explore Our Services

Business Development
Oil & Gas an extractive industry, participants must continuously find and develop new oil & gas fields as existing fields decline, making business development a continuous process.

Strategy
We approach strategy through a scenario driven assessment of the client’s current portfolio, organizational competencies, and financial framework. The strategy defines portfolio actions and coveted asset attributes.
Origination
Deal origination consists of identifying coveted assets, assets with attributes consistent with the client’s strategy, and qualified buyers. We advocate a proactive approach to business development and will undertake outreach on our client’s behalf.

Transaction Support
Transaction support consists of in depth asset evaluation, negotiation of commercial agreements or preparation of license round submission and close out of conditions. We can also aid in joint venture set up and management and asset maturation as required.