Oil Market Forecast - March 2021
Summary
This March edition of our Oil Market Forecast comes as the OPEC+ supply schedule, agreed in January 2021 expires, which makes this a good time to examine how OPEC+ curbs could evolve through the rest of the year. March also saw the publication of Oil 2021, the IEA’s updated medium term oil market report, the first update from the IEA this year. We spend some time looking at how their demand forecast, in particular, has changed over the last few months.
A few key points:
- The IEA’s updated medium term oil market report suggests a significant increase in medium term oil demand when compared to their long term “Stated Policies” demand case.
- There is a substantial gap in the breakeven oil price required between the large OPEC nations and Russia, resulting in a divergence of interests as oil demand and prices recover.
- The last year saw the US Shale oil industry generate positive free cashflow for the first time in its history.
- Even with a return in US Shale investment, we forecast US oil production will decline through the decade.
- The original OPEC+ supply curb schedule is too tight for demand levels in the current oil market, even with substantial above quota production from Russia.
- Oil demand in 2021 is not yet strong enough to support a return to full productions levels from OPEC+ nations.
- We expect to see a continued relaxation of OPEC+ production curbs throughout the rest of the year, with the non-OPEC nations returning to full production and OPEC curbs relaxing through the second half of the year.
- Both WTI and Brent futures have been stable over the last month.
- The US land oil rig count continues to climb but does not appear to be accelerating at the moment.
IEA Oil 2021
March saw the International Energy Agency (IEA) publish their annual 5 year oil market forecast – Oil 2021 (1). We featured a review of the various publicly available oil demand forecasts in the fourth quarter of last year (see Oil Demand Forecast – October 2020) and concluded that the IEA “Stated Polices”, and OPEC Long Term Oil Demand seemed to the most likely. This makes the IEA update of particular interest.
As the first oil demand update since last October last year it is worth considering how their thinking has evolved over that period; the results, shown in Figure 1, are rather surprising.
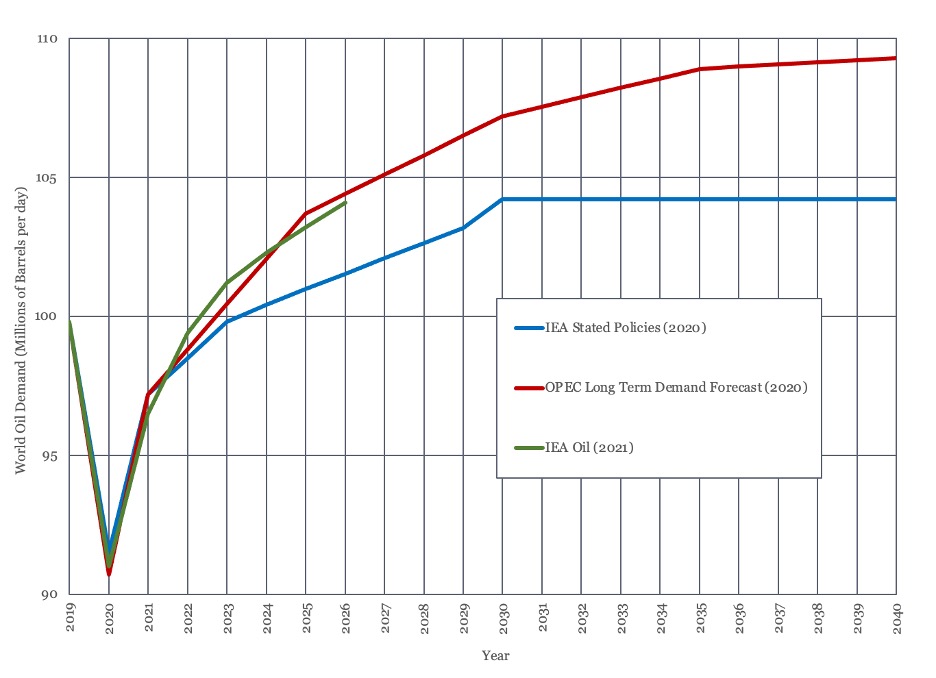
Figure 1 - Comparison of Long Term Oil Demand Estimates
The IEA is now predicting slightly slower oil demand growth in 2020, but much higher demand growth through the first half of the 2020’s. The IEA is now predicting oil demand at 104.1 MMbbl/day in 2026, a level that it previously expected oil demand to plateau at in 2030. While the strength of this rebound is surprising, it should be noted that this still falls 2 MMbbl/day short for the IEA’s pre-COVID 19 demand estimates. This update brings the IEA forecast through to 2026 into line with the OPEC Long Term Forecast from last year, meaning the two forecasts the author deems most credible are now in consensus in the medium term.
The IEA’s Oil 2021 report stresses that its latest forecast is based on current economic policies and is not consistent with a mid-century goal of net zero emissions, which would require more aggressive legislative action to hasten the energy transition. This suggests there is potential for lower growth due to forthcoming climate legislation. There are also a lot of uncertainty about how COVID 19 will change behavior – will people return to international travel for leisure and business or start to commute to the workplace on a regular basis again – that would impact oil demand. There is probably as much upside as downside in the IEA’s latest prediction; it looks like a reasonable best estimate.
Oil Market March 2020 – March 2021
The last year has been an eventful one for oil markets. To provide a brief recap, March 8th, 2020 saw a failure of attempts between Saudi Arabia and Russia to co-ordinate supply curbs in the face of declining demand due to COVID 19, triggering a price war between the two nations that flooded the oil market. Just one month later, on April 8th, 2020, OPEC and Russia agreed to an unprecedented 10 Mmbbl/day cut in supply, in an attempt to support the market as the COVID-19 pandemic gathered pace. This agreement cut production in three phases:
1st May 2020 – 30th June 2020: 10 MMbbl/day
1st July 2020 – 31st December 2021: 8 MMbbl/day
1st January 2021 – 30th April 2022: 6 MMbbl/day
This agreement was remarkably durable throughout 2020 and achieved the intended aim of stabilizing the market.
By January 2021 things had shifted a little. The OPEC+ group agreed to a schedule voluntary production curbs between Jan 2021 and March 2021 of 7.2 MMbbl/day to 7.05 MMbbl/day. Beyond March 2021, production levels would be agreed on a month to month basis, with reference made to observation of the principles agreed at the December 2020 OPEC+ meeting. Saudi Arabia then introduced an additional, unilateral cut of 1 MMbbl/day to its own production, from February.
At the March 2021 OPEC+ meeting, it was agreed that the April 2021 production curbs would be 6.9 MMbbl/day, with all production being returned by Russia and Kazakhstan, and Saudi Arabia once more committed to extend its additional, voluntary 1 MMbbl/day cut through April. While the oil market remains reliant on these production curbs for balance, prices have recovered and investment has started to flow back to the US onshore, creating a dynamic similar to the one that triggered the price war of a year ago.
Where does OPEC+ production go from here? The original April 2020 supply deal appears to have been opened, with the non-OPEC nations more aggressive in their push to return production to market. While there may no longer be a formal agreement on production levels covering the next 12 months, there appears to be a broad commitment to maintain balance, or a supply deficit, with current curbs exceeding those originally agreed in April last year.
OPEC+ Breakeven Prices
One way to think about long term oil price is to think in terms of the breakeven price required to make exploration, development, and production possible. Over recent years, oil companies have increasingly begun to talk in terms of breakeven prices; the oil price they require to cover their cost of capital or achieve a certain return. Nations also have breakeven prices.
Russia and Saudi Arabia, the two largest producers outside of the US, have lifting costs of $3.40 and $2.80 per barrel respectively (2). Based on the latest survey from the Dallas Federal Reserve (3), US shale needs an average of between $23 and $32 per barrel to cover lifting costs depending on the play. Given the aggressive nature of shale declines, a better comparison may be lifecycle well costs, which are $46-52 per barrel, as Saudi and Russian field are long life. If Saudi Arabia and Russia only had to cover their lifting costs, there would be no economic reason for either of them to curb oil production at anything above $4/bbl.
Of course, both Saudi Arabia and Russia, and many other nations, rely on their oil exports to support their economies. This, rather than lifting costs, is the calculation that matters when they think about the breakeven oil price. In looking at OPEC countries, fiscal breakeven, the oil price required to balance the budget, tend to be higher rather than current account breakeven. As Russia has amassed substantial foreign currency reserves this paper will focus on fiscal breakeven prices.
Figure 2, below shows the fiscal break-even oil price for the largest OPEC producers (4) and Russia (2). Iran is excluded from this analysis as its production is curtailed by US sanctions. The smaller OPEC producers have higher breakeven prices.
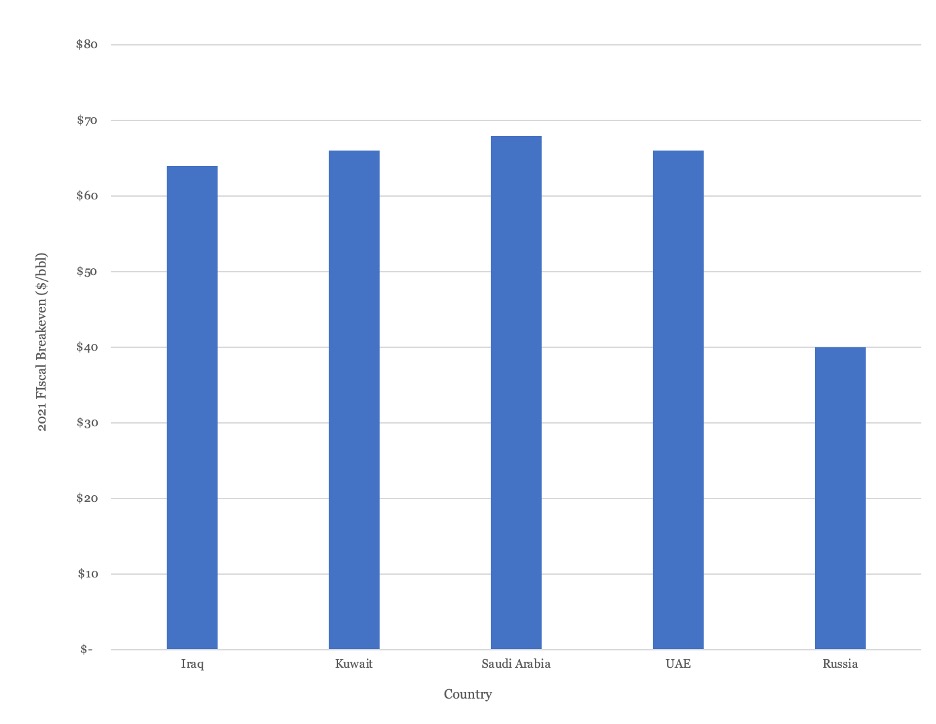
Figure 2 - 2021 Fiscal Break-Even Oil Price Select OPEC Nations and Russia
As Figure 2 shows, the largest OPEC producers all require an oil price in the mid $60’s to achieve fiscal breakeven, whereas Russia’s breakeven is appreciable lower, at $40/bbl. The large OPEC producers currently require price levels is line with US shale producers on a full lifecycle basis at corporate level. With a structurally lower fiscal breakeven and large foreign exchange reserves, Russia has historically produced at full capacity, rather than rely on supply curbs to boost prices. Indeed, Russia can survive at oil price levels that OPEC and US shale cannot and has been vocal in the past about its unwillingness to yield market share to higher cost producers.
These fundamentals set Russia at odds with OPEC as demand and prices recover. Indeed, Russia has been producing substantially above its agreed quote since August of 2020. How much longer will it be willing to curb its own production, especially if US shale shows signs of resurgence?
Shale Oil Matures
COVID-19 did more than just trigger unprecedented supply curbs. It succeeded where capital, technology and human ingenuity failed – it created an environment where the US shale industry generated positive free cashflow for a year. Figure 3, below, is reproduced from a report by the Institute for Energy Economics and Financial Analysis (5) and shows that 2020 was the first year that the 30 shale oil companies that it follows produced an aggregate positive free cashflow in the 10 years that it has been tracking them.
Lorem ipsum dolor sit amet, sapien platea morbi dolor lacus nunc, nunc ullamcorper. Felis aliquet egestas vitae, nibh ante quis quis dolor sed mauris. Erat lectus sem ut lobortis, adipiscing ligula eleifend, sodales fringilla mattis dui nullam. Ac massa aliquet.
The report ascribes this change to a reduction in capital spending, which fell to its lowest level ever for the 30 companies tracked in 2020. Having finally found a profitable formula, these companies, or their investors are likely to insist on tighter capital spending going forward. But this reduced spending is not consistent with expanding, or even stable US production. US production fell from a record of 17.2 MMbbl/day in 2019 to 16.5 MMbbl/day in 2020. Even with the modest recovery in US activity predicted over the next few years, this will not be enough to even maintain production at 2020 levels. Our forecast shows US production declining to 14 MMbbl/day by the end of the decade.
Oil Market Supply and Demand Scenarios
Despite the discouraging news from the European Union on a slow vaccine roll out and the return to some lockdowns, the consensus seems to be that oil demand will recover sharply in the second half of the year, with demand expected to jump from 93.7 MMbbl/day in Q1 2021 to 99.6 MMbbl/day by Q4.
As the OPEC+ group has now moved to a system of agreeing production quotas from month to month it is harder to predict how supply will evolve as the year progresses. In this section we approach the problem by exploring some different supply scenarios to understand each would impact market balance.
The return of Iranian oil to export markets as a variable has been excluded from this evaluation, on the basis that there is unlikely to be broad support for lifting sanctions while the oil market remains so oversupplied. Instead, all forecasts assume that Iranian crude production starts to return in 2022, reaching 3.5 MMbbl/day in 2024. The other big variable, US shale oil production, is expected to decline over the study period, despite assumed annal budget increases of 15% in 2022 and 2023.
The three scenarios – April 2020, End of OPEC+ and No Restraint are presented and discussed below.
April 2020
This scenario represents the most aggressive interpretation of supply curbs. Under this scenario, OPEC+ will maintain the supply curb schedule agreed in April 2020 through until April 2022. This involves holding 6 MMbbl/day from the market over this period. Under this scenario, actual OPEC+ production would stay essentially flat for the rest of the year, with the formal relaxation in production curbs offsetting existing overproduction by Russia.
Under this scenario, the oil market would remain in deficit, which would widen as demand recovers. Long term oil storage, as shown in Figure 4, would fall to long term average levels in mid 2021 and continue to decline from there. This would bring storage levels below long term average just as real demand starts to return, which could be expected to trigger a surge in prices. This scenario doesn’t appear realistic, and it may be why OPEC have adopted a policy of tracking the market and making adjustments on a month to month basis, rather than sticking with the original schedule.
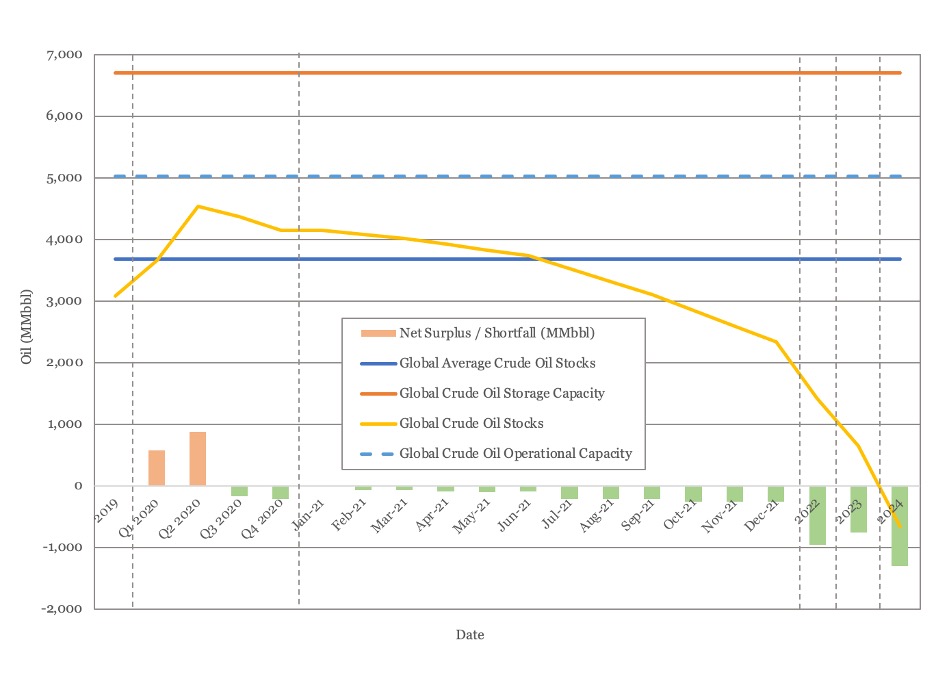
Figure 4 - April 2020 Scenario Global Storage Plot
End of OPEC+
This is a middle ground scenario, in which OPEC maintains its planned supply curbs, but where OPEC+ breaks down and the non-OPEC members return to producing at capacity. Under this scenario, the market would be balanced through May and June, but then swing back to widening deficit in the second half of the year as demand recovers. Global storage, as shown in Figure 5, would fall back to 2019 levels by year end and continue to fall sharply from there.
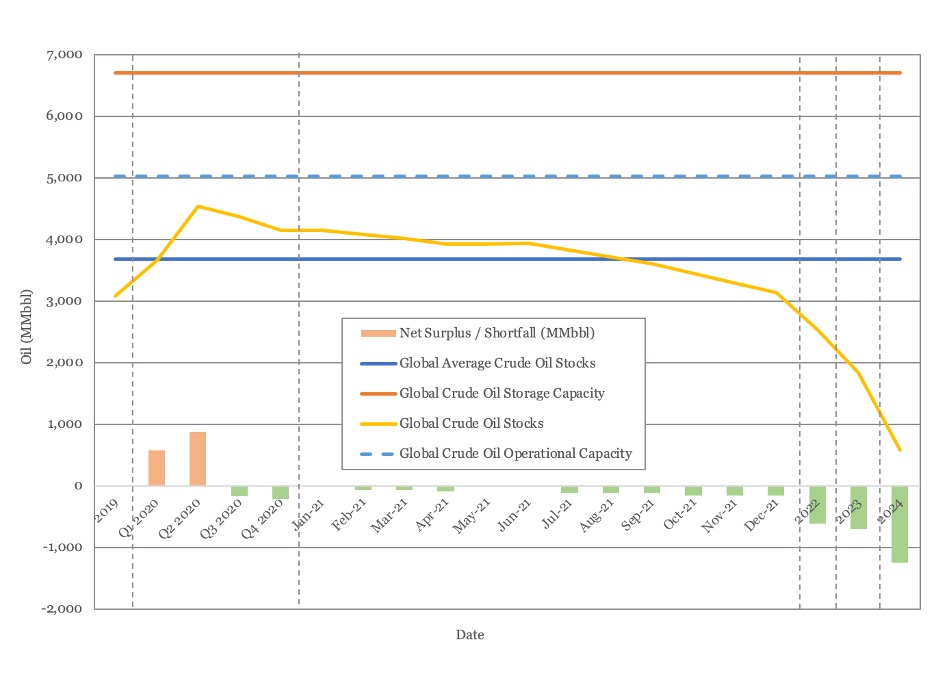
Figure 5 - Global Oil Storage Under the End of OPEC+ Scenario
No Restraint
This scenario is intended to represent the opposite of April 2020. Under this scenario, agreement among the OPEC+ group of nations breaks down, with all participants returning to full production in May 2020. The market would flip to surplus from May, a surplus that would persist until demand growth outstripped it in 2023. Global oil storage, as shown in Figure 6 would climb steadily back to 4.5 billion barrels in 2022, the same peak that they reached in 2020 in the depths of the COVID pandemic.
Oil prices under this scenario could be expected to collapse again. With reference to the earlier discussion on OPEC breakeven prices, that factor alone is what renders this scenario unlikely. It can’t be ruled out, after all it happened a year ago when the demand picture was a lot less optimistic than it is today, but the likelihood is low.
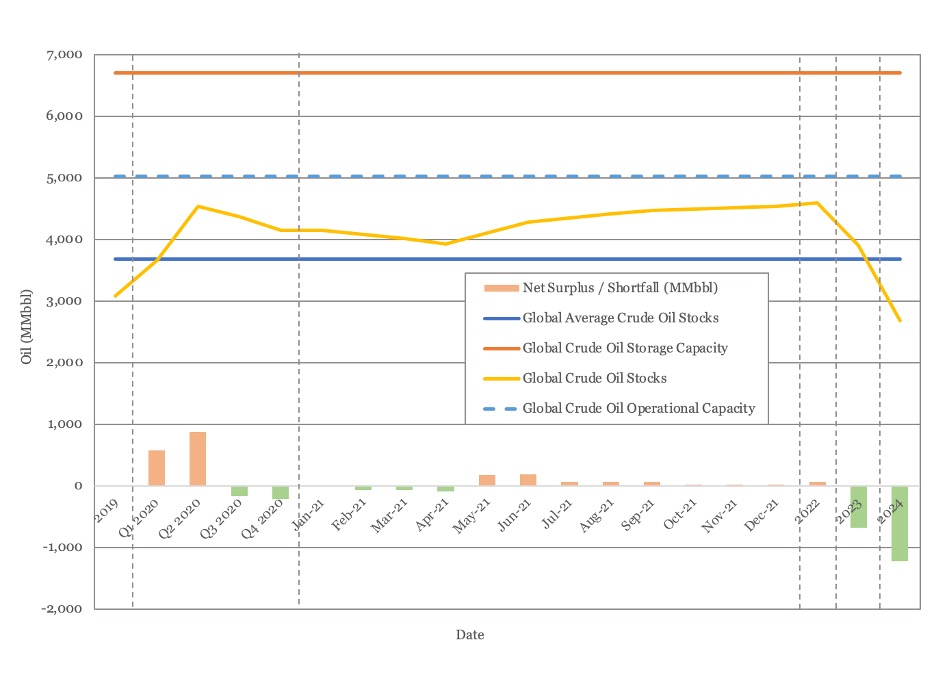
Figure 6 - Global Oil Storage under No Restraint Scenario
Conclusion
The April 2020 scenario looks neither desirable, nor likely. The most likely probably sits somewhere in between End of OPEC+ and No Restraint, with No Restraint representing a worst case scenario for the market. We can certainly expect to see the current OPEC+ supply curbs relaxed as we move through the second half of the year, with the OPEC+ nations returning to full production before the OPEC nations themselves began to relax production quotas.
One common thread that emerges from all the scenarios is market balance beyond 2022, when real demand growth is forecast to return. In all cases, the current data shows that will be a growing supply deficit, something that should spur a return of investment to the industry in the coming year.
Oil Prices
While oil market balance requires a group of producers to voluntarily withhold millions of barrels of production from the market, the oil price continues to rise. WTI has been bouncing around the $60/barrel mark, touching $66/barrel earlier in the month. Brent came close to the $70/barrel mark a couple of times.
Both Brent and WTI futures curves have been stable over the last month, see Figure 7, with both showing an increase in pricing through to 2024, but lower prices further out. This could be interpreted as an improvement in the demand picture in the medium term, but deterioration further out.
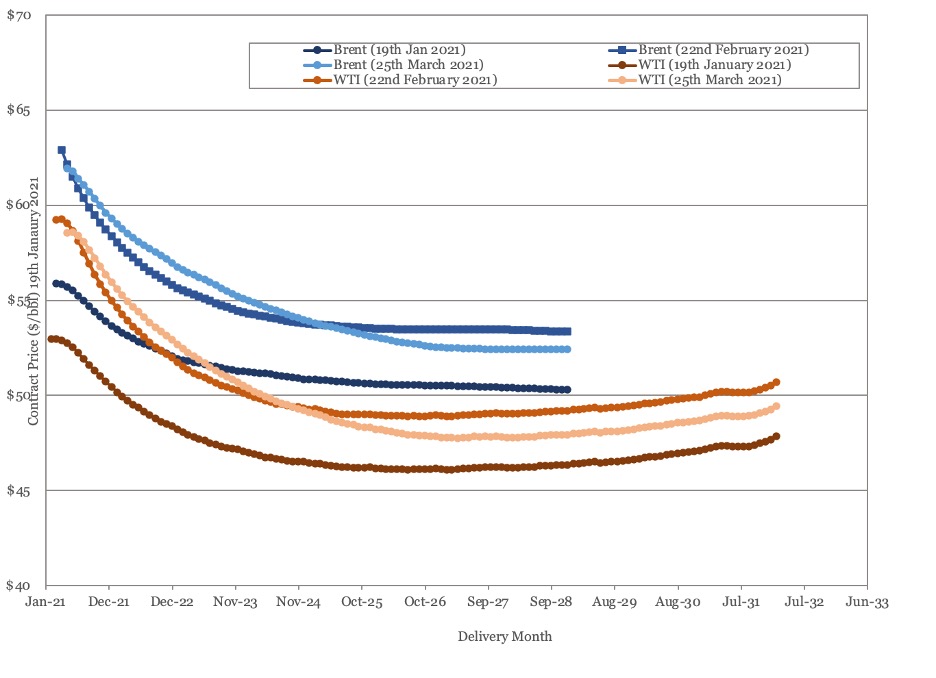
Figure 7 - Brent and WTI Crude Oil Futures (March 25, 2021)
US Activity
US land oil rig counts continued to climb in March, rising from 292 on the 26th of February 312 on the 26th of March. The improvement in oil prices that has been sustained over the last month does not appear to have led to any increase in the rate of rig deployment as yet. Historic and forecast rig counts are shown in Figure 8.
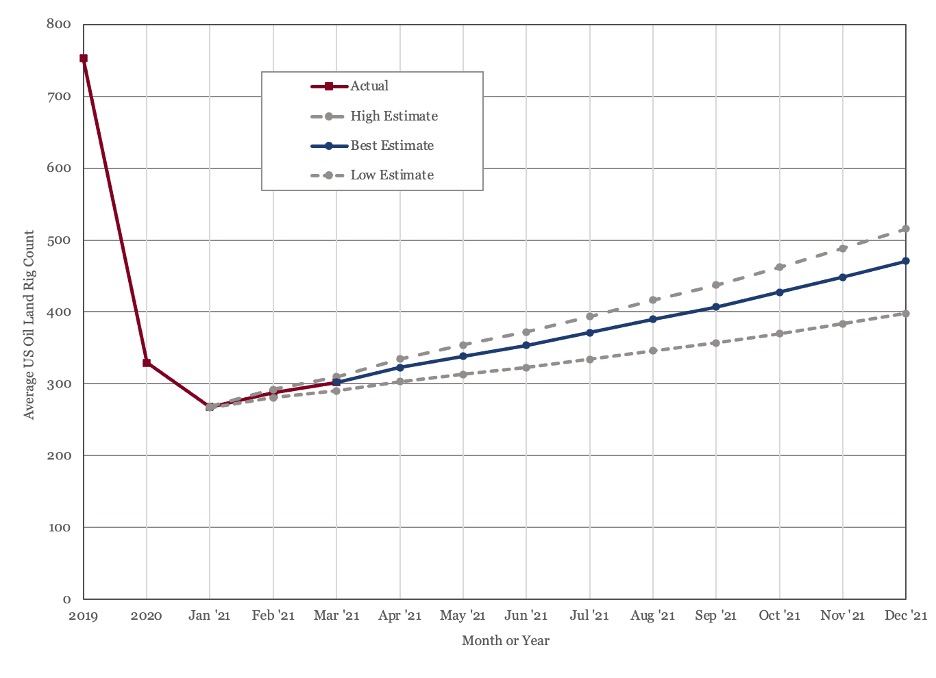
Figure 8 - US Land Oil Rig Count
(1) “Oil 2021”, International Energy Agency, March 2021
(2) “Russian Federation Staff Report for the 2020 Article IV Consultation”, International Monetary Fund, February 2nd 2021
(3) “Energy Slideshow”, Federal Reserve Bank of Dallas, March 3rd 2021
(4) “Regional Economic Outlook Update: Middle East and Central Asia, Statistical Appendix”, International Monetary Fund, October 19th 2020.
(5) “In a Tumultuous 2020, Shale Firms Slashed Capex To Generate Cash”, Williams-Derry, Cowan and Solanki, Institute for Energy Economics and Financial Analysis, March 2021.
Oil Market Forecast - March 2021
Summary
This March edition of our Oil Market Forecast comes as the OPEC+ supply schedule, agreed in January 2021, expires, which makes this a good time to examine how OPEC+ curbs could evolve through the rest of the year. March also saw the publication of Oil 2021, the IEA’s updated medium term oil market report, the first update from the IEA this year. We spend some time looking at how their demand forecast, in particular, has changed over the last few months.
A few key points:
- The IEA’s updated medium term oil market report suggests a significant increase in medium term oil demand when compared to their long term “Stated Policies” demand case.
- There is a substantial gap in the breakeven oil price required between the large OPEC nations and Russia, resulting in a divergence of interests as oil demand and prices recover.
- The last year saw the US Shale oil industry generate positive free cashflow for the first time in its history.
- Even with a return in US Shale investment, we forecast US oil production will decline through the decade.
- The original OPEC+ supply curb schedule is too tight for demand levels in the current oil market, even with substantial above quota production from Russia.
- Oil demand in 2021 is not yet strong enough to support a return to full productions levels from OPEC+ nations.
- We expect to see a continued relaxation of OPEC+ production curbs throughout the rest of the year, with the non-OPEC nations returning to full production and OPEC curbs relaxing through the second half of the year.
- Both WTI and Brent futures have been stable over the last month.
- The US land oil rig count continues to climb but does not appear to be accelerating at the moment.
IEA Oil 2021
March saw the International Energy Agency (IEA) publish their annual 5 year oil market forecast – Oil 2021 (1). We featured a review of the various publicly available oil demand forecasts in the fourth quarter of last year (see Oil Demand Forecast – October 2020) and concluded that the IEA “Stated Polices”, and OPEC Long Term Oil Demand seemed to the most likely. This makes the IEA update of particular interest.
As the first oil demand update since last October last year it is worth considering how their thinking has evolved over that period; the results, shown in Figure 1, are rather surprising.
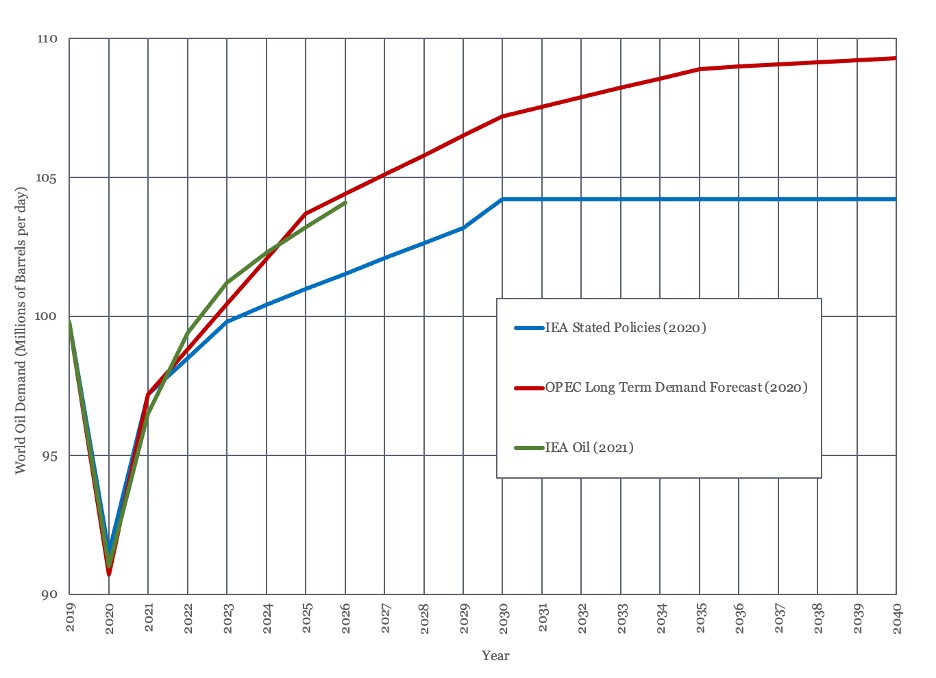
Figure 1 - Comparison of Long Term Oil Demand Estimates
The IEA is now predicting slightly slower oil demand growth in 2020, but much higher demand growth through the first half of the 2020’s. The IEA is now predicting oil demand at 104.1 MMbbl/day in 2026, a level that it previously expected oil demand to plateau at in 2030. While the strength of this rebound is surprising, it should be noted that this still falls 2 MMbbl/day short for the IEA’s pre-COVID 19 demand estimates. This update brings the IEA forecast through to 2026 into line with the OPEC Long Term Forecast from last year, meaning the two forecasts the author deems most credible are now in consensus in the medium term.
The IEA’s Oil 2021 report stresses that its latest forecast is based on current economic policies and is not consistent with a mid-century goal of net zero emissions, which would require more aggressive legislative action to hasten the energy transition. This suggests there is potential for lower growth due to forthcoming climate legislation. There are also a lot of uncertainty about how COVID 19 will change behavior – will people return to international travel for leisure and business or start to commute to the workplace on a regular basis again – that would impact oil demand. There is probably as much upside as downside in the IEA’s latest prediction; it looks like a reasonable best estimate.
Oil Market March 2020 – March 2021
The last year has been an eventful one for oil markets. To provide a brief recap, March 8th, 2020 saw a failure of attempts between Saudi Arabia and Russia to co-ordinate supply curbs in the face of declining demand due to COVID 19, triggering a price war between the two nations that flooded the oil market. Just one month later, on April 8th, 2020, OPEC and Russia agreed to an unprecedented 10 Mmbbl/day cut in supply, in an attempt to support the market as the COVID-19 pandemic gathered pace. This agreement cut production in three phases:
1st May 2020 – 30th June 2020: 10 MMbbl/day
1st July 2020 – 31st December 2021: 8 MMbbl/day
1st January 2021 – 30th April 2022: 6 MMbbl/day
This agreement was remarkably durable throughout 2020 and achieved the intended aim of stabilizing the market.
By January 2021 things had shifted a little. The OPEC+ group agreed to a schedule voluntary production curbs between Jan 2021 and March 2021 of 7.2 MMbbl/day to 7.05 MMbbl/day. Beyond March 2021, production levels would be agreed on a month to month basis, with reference made to observation of the principles agreed at the December 2020 OPEC+ meeting. Saudi Arabia then introduced an additional, unilateral cut of 1 MMbbl/day to its own production, from February.
At the March 2021 OPEC+ meeting, it was agreed that the April 2021 production curbs would be 6.9 MMbbl/day, with all production being returned by Russia and Kazakhstan, and Saudi Arabia once more committed to extend its additional, voluntary 1 MMbbl/day cut through April. While the oil market remains reliant on these production curbs for balance, prices have recovered and investment has started to flow back to the US onshore, creating a dynamic similar to the one that triggered the price war of a year ago.
Where does OPEC+ production go from here? The original April 2020 supply deal appears to have been opened, with the non-OPEC nations more aggressive in their push to return production to market. While there may no longer be a formal agreement on production levels covering the next 12 months, there appears to be a broad commitment to maintain balance, or a supply deficit, with current curbs exceeding those originally agreed in April last year.
OPEC+ Breakeven Prices
One way to think about long term oil price is to think in terms of the breakeven price required to make exploration, development, and production possible. Over recent years, oil companies have increasingly begun to talk in terms of breakeven prices; the oil price they require to cover their cost of capital or achieve a certain return. Nations also have breakeven prices.
Russia and Saudi Arabia, the two largest producers outside of the US, have lifting costs of $3.40 and $2.80 per barrel respectively (2). Based on the latest survey from the Dallas Federal Reserve (3), US shale needs an average of between $23 and $32 per barrel to cover lifting costs depending on the play. Given the aggressive nature of shale declines, a better comparison may be lifecycle well costs, which are $46-52 per barrel, as Saudi and Russian field are long life. If Saudi Arabia and Russia only had to cover their lifting costs, there would be no economic reason for either of them to curb oil production at anything above $4/bbl.
Of course, both Saudi Arabia and Russia, and many other nations, rely on their oil exports to support their economies. This, rather than lifting costs, is the calculation that matters when they think about the breakeven oil price. In looking at OPEC countries, fiscal breakeven, the oil price required to balance the budget, tend to be higher rather than current account breakeven. As Russia has amassed substantial foreign currency reserves this paper will focus on fiscal breakeven prices.
Figure 2, below shows the fiscal break-even oil price for the largest OPEC producers (4) and Russia (2). Iran is excluded from this analysis as its production is curtailed by US sanctions. The smaller OPEC producers have higher breakeven prices.
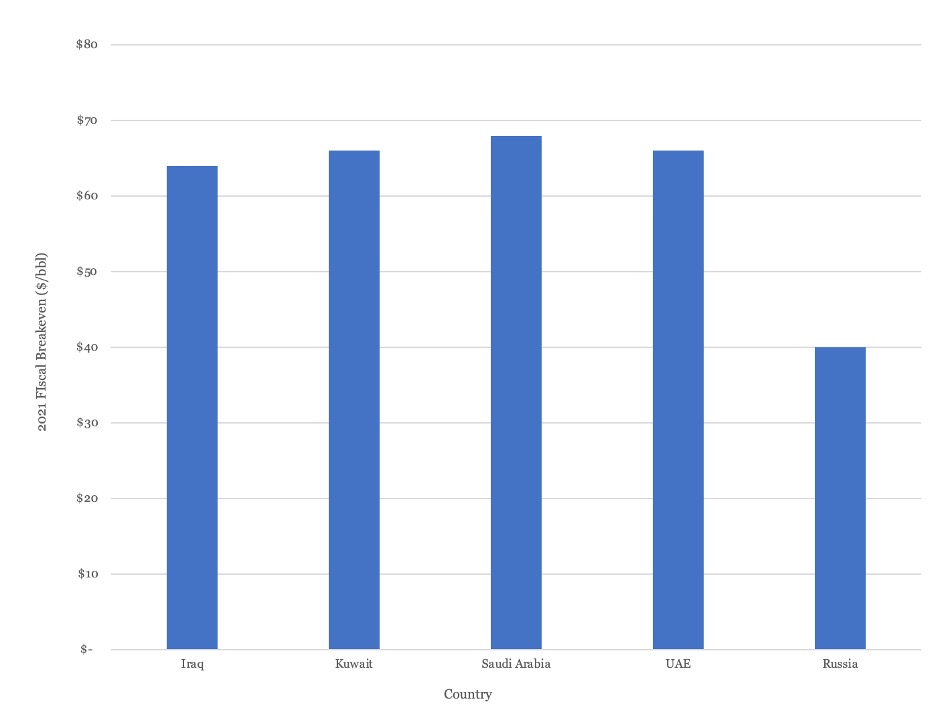
Figure 2 - 2021 Fiscal Break-Even Oil Price Select OPEC Nations and Russia
As Figure 2 shows, the largest OPEC producers all require an oil price in the mid $60’s to achieve fiscal breakeven, whereas Russia’s breakeven is appreciable lower, at $40/bbl. The large OPEC producers currently require price levels is line with US shale producers on a full lifecycle basis at corporate level. With a structurally lower fiscal breakeven and large foreign exchange reserves, Russia has historically produced at full capacity, rather than rely on supply curbs to boost prices. Indeed, Russia can survive at oil price levels that OPEC and US shale cannot and has been vocal in the past about its unwillingness to yield market share to higher cost producers.
These fundamentals set Russia at odds with OPEC as demand and prices recover. Indeed, Russia has been producing substantially above its agreed quote since August of 2020. How much longer will it be willing to curb its own production, especially if US shale shows signs of resurgence?
Shale Oil Matures
COVID-19 did more than just trigger unprecedented supply curbs. It succeeded where capital, technology and human ingenuity failed – it created an environment where the US shale industry generated positive free cashflow for a year. Figure 3, below, is reproduced from a report by the Institute for Energy Economics and Financial Analysis (5) and shows that 2020 was the first year that the 30 shale oil companies that it follows produced an aggregate positive free cashflow in the 10 years that it has been tracking them.
The report ascribes this change to a reduction in capital spending, which fell to its lowest level ever for the 30 companies tracked in 2020. Having finally found a profitable formula, these companies, or their investors are likely to insist on tighter capital spending going forward. But this reduced spending is not consistent with expanding, or even stable US production. US production fell from a record of 17.2 MMbbl/day in 2019 to 16.5 MMbbl/day in 2020. Even with the modest recovery in US activity predicted over the next few years, this will not be enough to even maintain production at 2020 levels. Our forecast shows US production declining to 14 MMbbl/day by the end of the decade.
Oil Market Supply and Demand Scenarios
Despite the discouraging news from the European Union on a slow vaccine roll out and the return to some lockdowns, the consensus seems to be that oil demand will recover sharply in the second half of the year, with demand expected to jump from 93.7 MMbbl/day in Q1 2021 to 99.6 MMbbl/day by Q4.
As the OPEC+ group has now moved to a system of agreeing production quotas from month to month it is harder to predict how supply will evolve as the year progresses. In this section we approach the problem by exploring some different supply scenarios to understand each would impact market balance.
The return of Iranian oil to export markets as a variable has been excluded from this evaluation, on the basis that there is unlikely to be broad support for lifting sanctions while the oil market remains so oversupplied. Instead, all forecasts assume that Iranian crude production starts to return in 2022, reaching 3.5 MMbbl/day in 2024. The other big variable, US shale oil production, is expected to decline over the study period, despite assumed annal budget increases of 15% in 2022 and 2023.
The three scenarios – April 2020, End of OPEC+ and No Restraint are presented and discussed below.
April 2020
This scenario represents the most aggressive interpretation of supply curbs. Under this scenario, OPEC+ will maintain the supply curb schedule agreed in April 2020 through until April 2022. This involves holding 6 MMbbl/day from the market over this period. Under this scenario, actual OPEC+ production would stay essentially flat for the rest of the year, with the formal relaxation in production curbs offsetting existing overproduction by Russia.
Under this scenario, the oil market would remain in deficit, which would widen as demand recovers. Long term oil storage, as shown in Figure 4, would fall to long term average levels in mid 2021 and continue to decline from there. This would bring storage levels below long term average just as real demand starts to return, which could be expected to trigger a surge in prices. This scenario doesn’t appear realistic, and it may be why OPEC have adopted a policy of tracking the market and making adjustments on a month to month basis, rather than sticking with the original schedule.
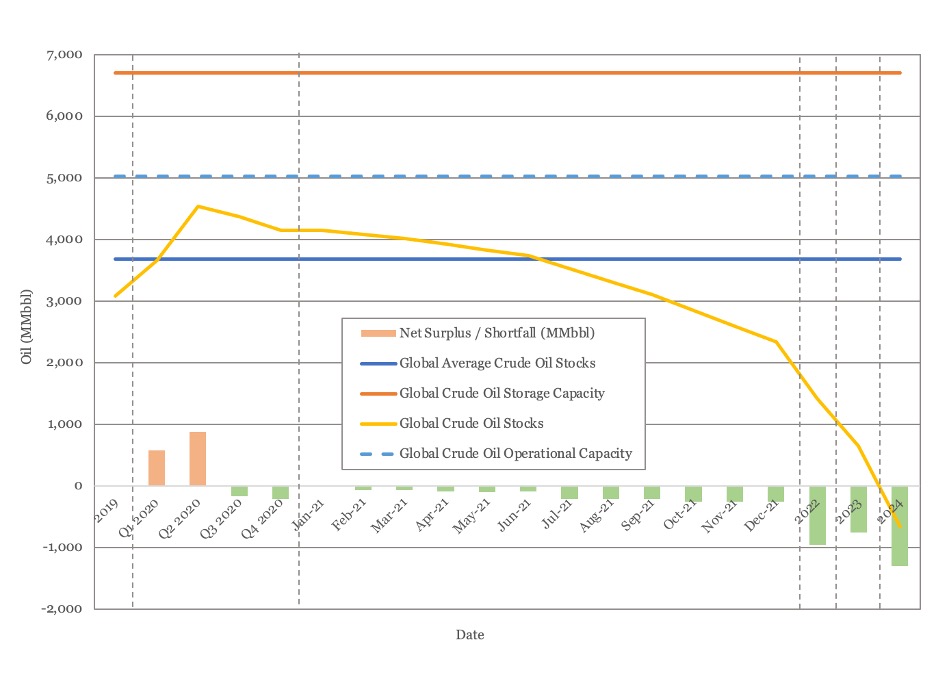
Figure 4 - April 2020 Scenario Global Storage Plot
End of OPEC+
This is a middle ground scenario, in which OPEC maintains its planned supply curbs, but where OPEC+ breaks down and the non-OPEC members return to producing at capacity. Under this scenario, the market would be balanced through May and June, but then swing back to widening deficit in the second half of the year as demand recovers. Global storage, as shown in Figure 5, would fall back to 2019 levels by year end and continue to fall sharply from there.
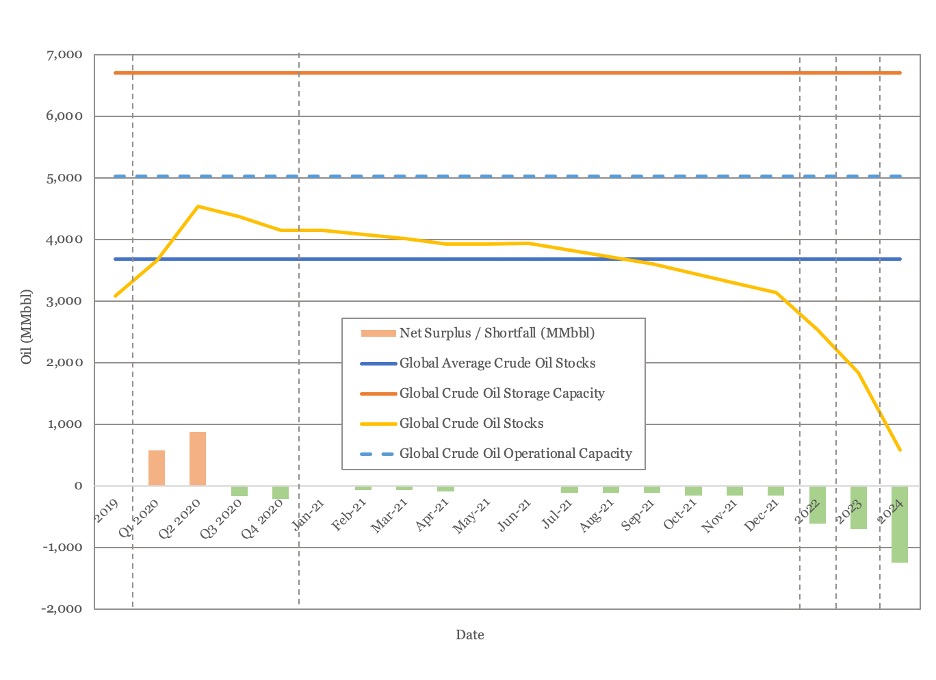
Figure 5 - Global Oil Storage Under the End of OPEC+ Scenario
No Restraint
This scenario is intended to represent the opposite of April 2020. Under this scenario, agreement among the OPEC+ group of nations breaks down, with all participants returning to full production in May 2020. The market would flip to surplus from May, a surplus that would persist until demand growth outstripped it in 2023. Global oil storage, as shown in Figure 6 would climb steadily back to 4.5 billion barrels in 2022, the same peak that they reached in 2020 in the depths of the COVID pandemic.
Oil prices under this scenario could be expected to collapse again. With reference to the earlier discussion on OPEC breakeven prices, that factor alone is what renders this scenario unlikely. It can’t be ruled out, after all it happened a year ago when the demand picture was a lot less optimistic than it is today, but the likelihood is low.
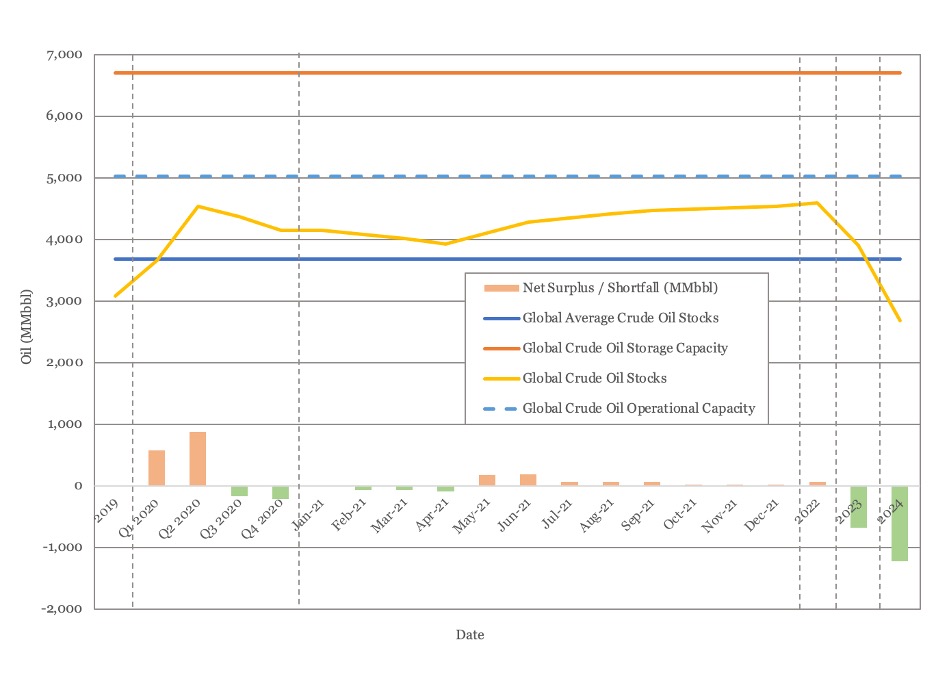
Figure 6 - Global Oil Storage under No Restraint Scenario
Conclusion
The April 2020 scenario looks neither desirable, nor likely. The most likely probably sits somewhere in between End of OPEC+ and No Restraint, with No Restraint representing a worst case scenario for the market. We can certainly expect to see the current OPEC+ supply curbs relaxed as we move through the second half of the year, with the OPEC+ nations returning to full production before the OPEC nations themselves began to relax production quotas.
One common thread that emerges from all the scenarios is market balance beyond 2022, when real demand growth is forecast to return. In all cases, the current data shows that will be a growing supply deficit, something that should spur a return of investment to the industry in the coming year.
Oil Prices
While oil market balance requires a group of producers to voluntarily withhold millions of barrels of production from the market, the oil price continues to rise. WTI has been bouncing around the $60/barrel mark, touching $66/barrel earlier in the month. Brent came close to the $70/barrel mark a couple of times.
Both Brent and WTI futures curves have been stable over the last month, see Figure 7, with both showing an increase in pricing through to 2024, but lower prices further out. This could be interpreted as an improvement in the demand picture in the medium term, but deterioration further out.
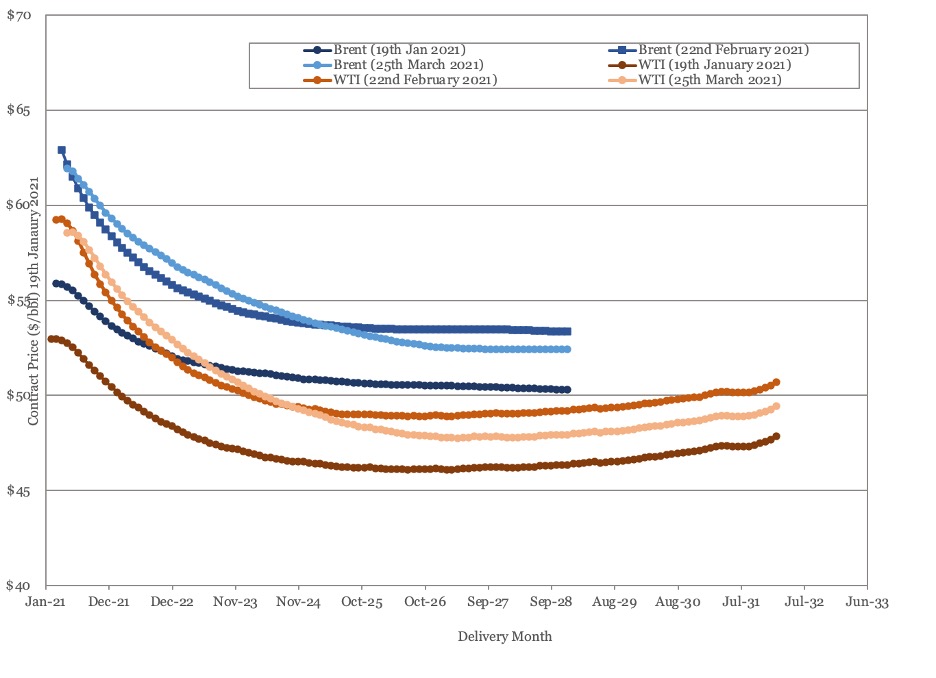
Figure 7 - Brent and WTI Crude Oil Futures (March 25, 2021)
US Activity
US land oil rig counts continued to climb in March, rising from 292 on the 26th of February 312 on the 26th of March. The improvement in oil prices that has been sustained over the last month does not appear to have led to any increase in the rate of rig deployment as yet. Historic and forecast rig counts are shown in Figure 8.
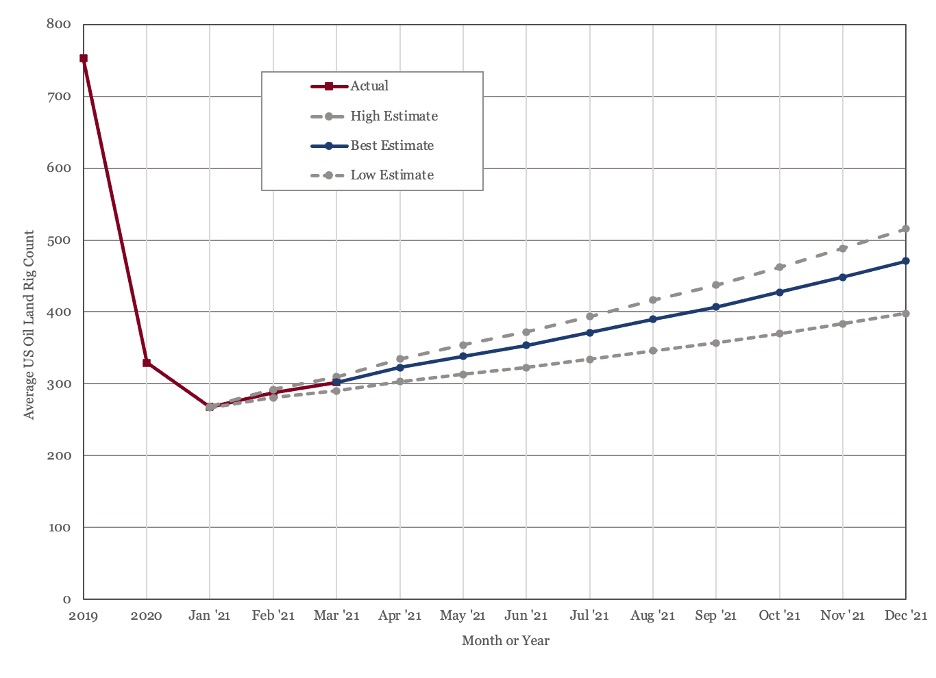
Figure 8 - US Land Oil Rig Count
(1) “Oil 2021”, International Energy Agency, March 2021
(2) “Russian Federation Staff Report for the 2020 Article IV Consultation”, International Monetary Fund, February 2nd 2021
(3) “Energy Slideshow”, Federal Reserve Bank of Dallas, March 3rd 2021
(4) “Regional Economic Outlook Update: Middle East and Central Asia, Statistical Appendix”, International Monetary Fund, October 19th 2020.
(5) “In a Tumultuous 2020, Shale Firms Slashed Capex To Generate Cash”, Williams-Derry, Cowan and Solanki, Institute for Energy Economics and Financial Analysis, March 2021.
Explore Our Services

Business Development
Oil & Gas an extractive industry, participants must continuously find and develop new oil & gas fields as existing fields decline, making business development a continuous process.

Strategy
We approach strategy through a scenario driven assessment of the client’s current portfolio, organizational competencies, and financial framework. The strategy defines portfolio actions and coveted asset attributes.


