Oil Market Forecast - October 2021
Summary
It’s been an eventful month in the oil industry, with rising gas prices and an energy crunch bringing energy security back onto the global agenda. The combination of factors that has European nations bringing coal and oil fired power back on line and looking for ways to shield their citizens from soaring energy prices comes just before the start of the UN Climate Change Conference in Glasgow. The COP 26 starts at the end of this month, and in preparation all the major forecasting agencies have updated their long term oil demand scenarios. We start by examining those, before looking at medium term supply and demand, storage, prices, and US activity.
A few key points:
- The IEA and EIA have both raised their reference estimates of long term oil demand, OPEC cut their estimate slightly.
- The IEA Stated Policies scenario and OPEC’s long term demand forecast are now close to identical, the EIA reference case predicts much higher oil demand.
- The reference case long term scenarios from each agency show oil demand growth through 2045 or 2050; barring substantial national policy changes oil demand is predicted to continue rising for the next 30 years.
- The IEA upgraded its demand estimate for 2021 and 2022; all forecasting agencies are now predicting 2022 oil demand above pre-pandemic levels.
- There were calls from the OPEC General Secretary and a warning from the Economist that current levels of investment in oil & gas infrastructure were not sufficient to meet demand, increasing the risk of volatility in energy prices.
- We estimate that global storage will have fallen to pre-pandemic levels by the end of the year and expect it to continue falling given the tight market.
- Prices reached new post-pandemic records and the futures market for Brent and WTI reached its highest level for the year.
- The US land oil rig count reached 431.
Long Term Oil Demand
The UN Climate Change Conference (COP26) is scheduled to start at the end of this month and in preparation the major energy agencies have issued updated long term oil demand forecasts. The IEA issued their World Energy Outlook 2021 (1), which includes updates to their Stated Policies, Announced Pledges and Sustainable Development scenarios. OPEC published their World Oil Outlook 2021 (2), which provides their estimate of demand through to 2045. Finally, the EIA published their first long term oil demand forecast update since 2019, in their Annual Energy Outlook 2021 (3). We will start by looking at the update to each forecast and then compare the three to see what, if any conclusions can be drawn.
International Energy Agency (IEA)
The IEA publishes four different forecasts, all running from now to 2050. The first is Stated Policies, which is their estimate of oil demand under current national policies. The second is Announced Pledges, which includes national commitments on top of existing legislation. The third is Sustainable Development, which reflects the oil demand that would be required to limit global warming to substantially less than 2 degrees celsius. The final one is Net Zero, which reflects the oil demand required to limit global warming to 1.5 degree celsius. Stated Polices and Announced Pledges are genuine forecasts, whereas Sustainable Development and Net Zero are illustrative of what would be required to hit UN Climate Change Conference targets. Stated Polices and Sustainable Development were published last year, Stated Policies was updated in May of this year at the same time as Announced Pledges and Net Zero were launched. In their latest report, the IEA have updated Stated Policies, Announced Pledges and Sustainable Development. A comparison of IEA long term oil demand forecasts is shown in Figure 1, below.

Figure 1 - – IEA Long Term Oil Demand Forecasts
(Based on data from International Energy Agency (2021), as modified by Glenloch Energy)
The first thing to note in the IEA forecast is that they seem to have downgraded historical demand. For example, in previous forecasts 2019 oil demand was 99.8 MMbbl/day and in these forecasts, it is shown as 98.6 MMbbl/day. This is probably a change to the internal definition of demand rather than a revision, as in the IEA’s latest publicly available Oil Market Report (July), 2019 demand is 99.7 MMbbl/day.
The second point to note is that long term demand in the Stated Policies case has been raised substantially, from 105 MMbbl/day in 2050 to 108.7 MMbbl/day in 2050. This contradicts the body of the IEA report, which makes the point repeatedly that oil demand will fall by 2050 in all scenarios. It turns out that both can be true. In this report the IEA have broken out biofuels under their definition of liquids, so when they talk about oil demand in the body of the text, they mean oil excluding biofuels, which they have traditionally grouped under oil demand. In the Stated Policies scenario, for example oil demand (excluding biofuels) rises to 103 MMbbl/day in 2030 and stays at 103 MMbbl/day in 2050. Under the same scenario, biofuels rise from 2 MMbbl/day in 2019 to 3.5 MMbbl/day in 2030 to 5.7 MMbbl/day in 2050. How realistic is this?
About half of the global demand for biofuels comes from the US, where ethanol is blended into gasoline, under a scheme that was originally formulated during the oil shocks of the 1970’s to bolster US energy security but has since become a hostage to special interests. The EIA, in their latest report, has biofuel demand in the US essentially flat through 2050 as there is no prospect of repeal, but no economic or environmental incentive for expanding the scheme. The IEA Stated Policies scenario assumes that ethanol use will double over the next 10 years.
The remainder of the growth comes from advanced biofuels, which are currently very expensive – the IEA quotes production costs of $85 - $160 per barrel. To quote the IEA report, “Advanced biofuels are produced from non-food crop feedstocks, result in significantly fewer greenhouse gas emissions than fossil fuels, do not compete with food for agricultural land and do not adversely affect sustainability.”, so they would mitigate the problems with ethanol. However, there is currently no global demand for advanced biofuels, presumable due to their cost.
Net Zero, which has oil demand falling to 24 MMbbl/day in 2050, was discussed in our June Oil Market Forecast and is not seen as being a realistic scenario. The same is true of Sustainable Development – to realize this outcome oil demand would have to start falling now and keep falling, which runs counter to all medium term demand forecasts including the IEA’s.
Organisation of the Petroleum Exporting Countries (OPEC)
The OPEC update is the most straightforward. OPEC has a single forecast, which is based on current national policies, and provides some narrative guidance on range. A comparison of the OPEC long term oil demand forecasts is shown in Figure 2, below.
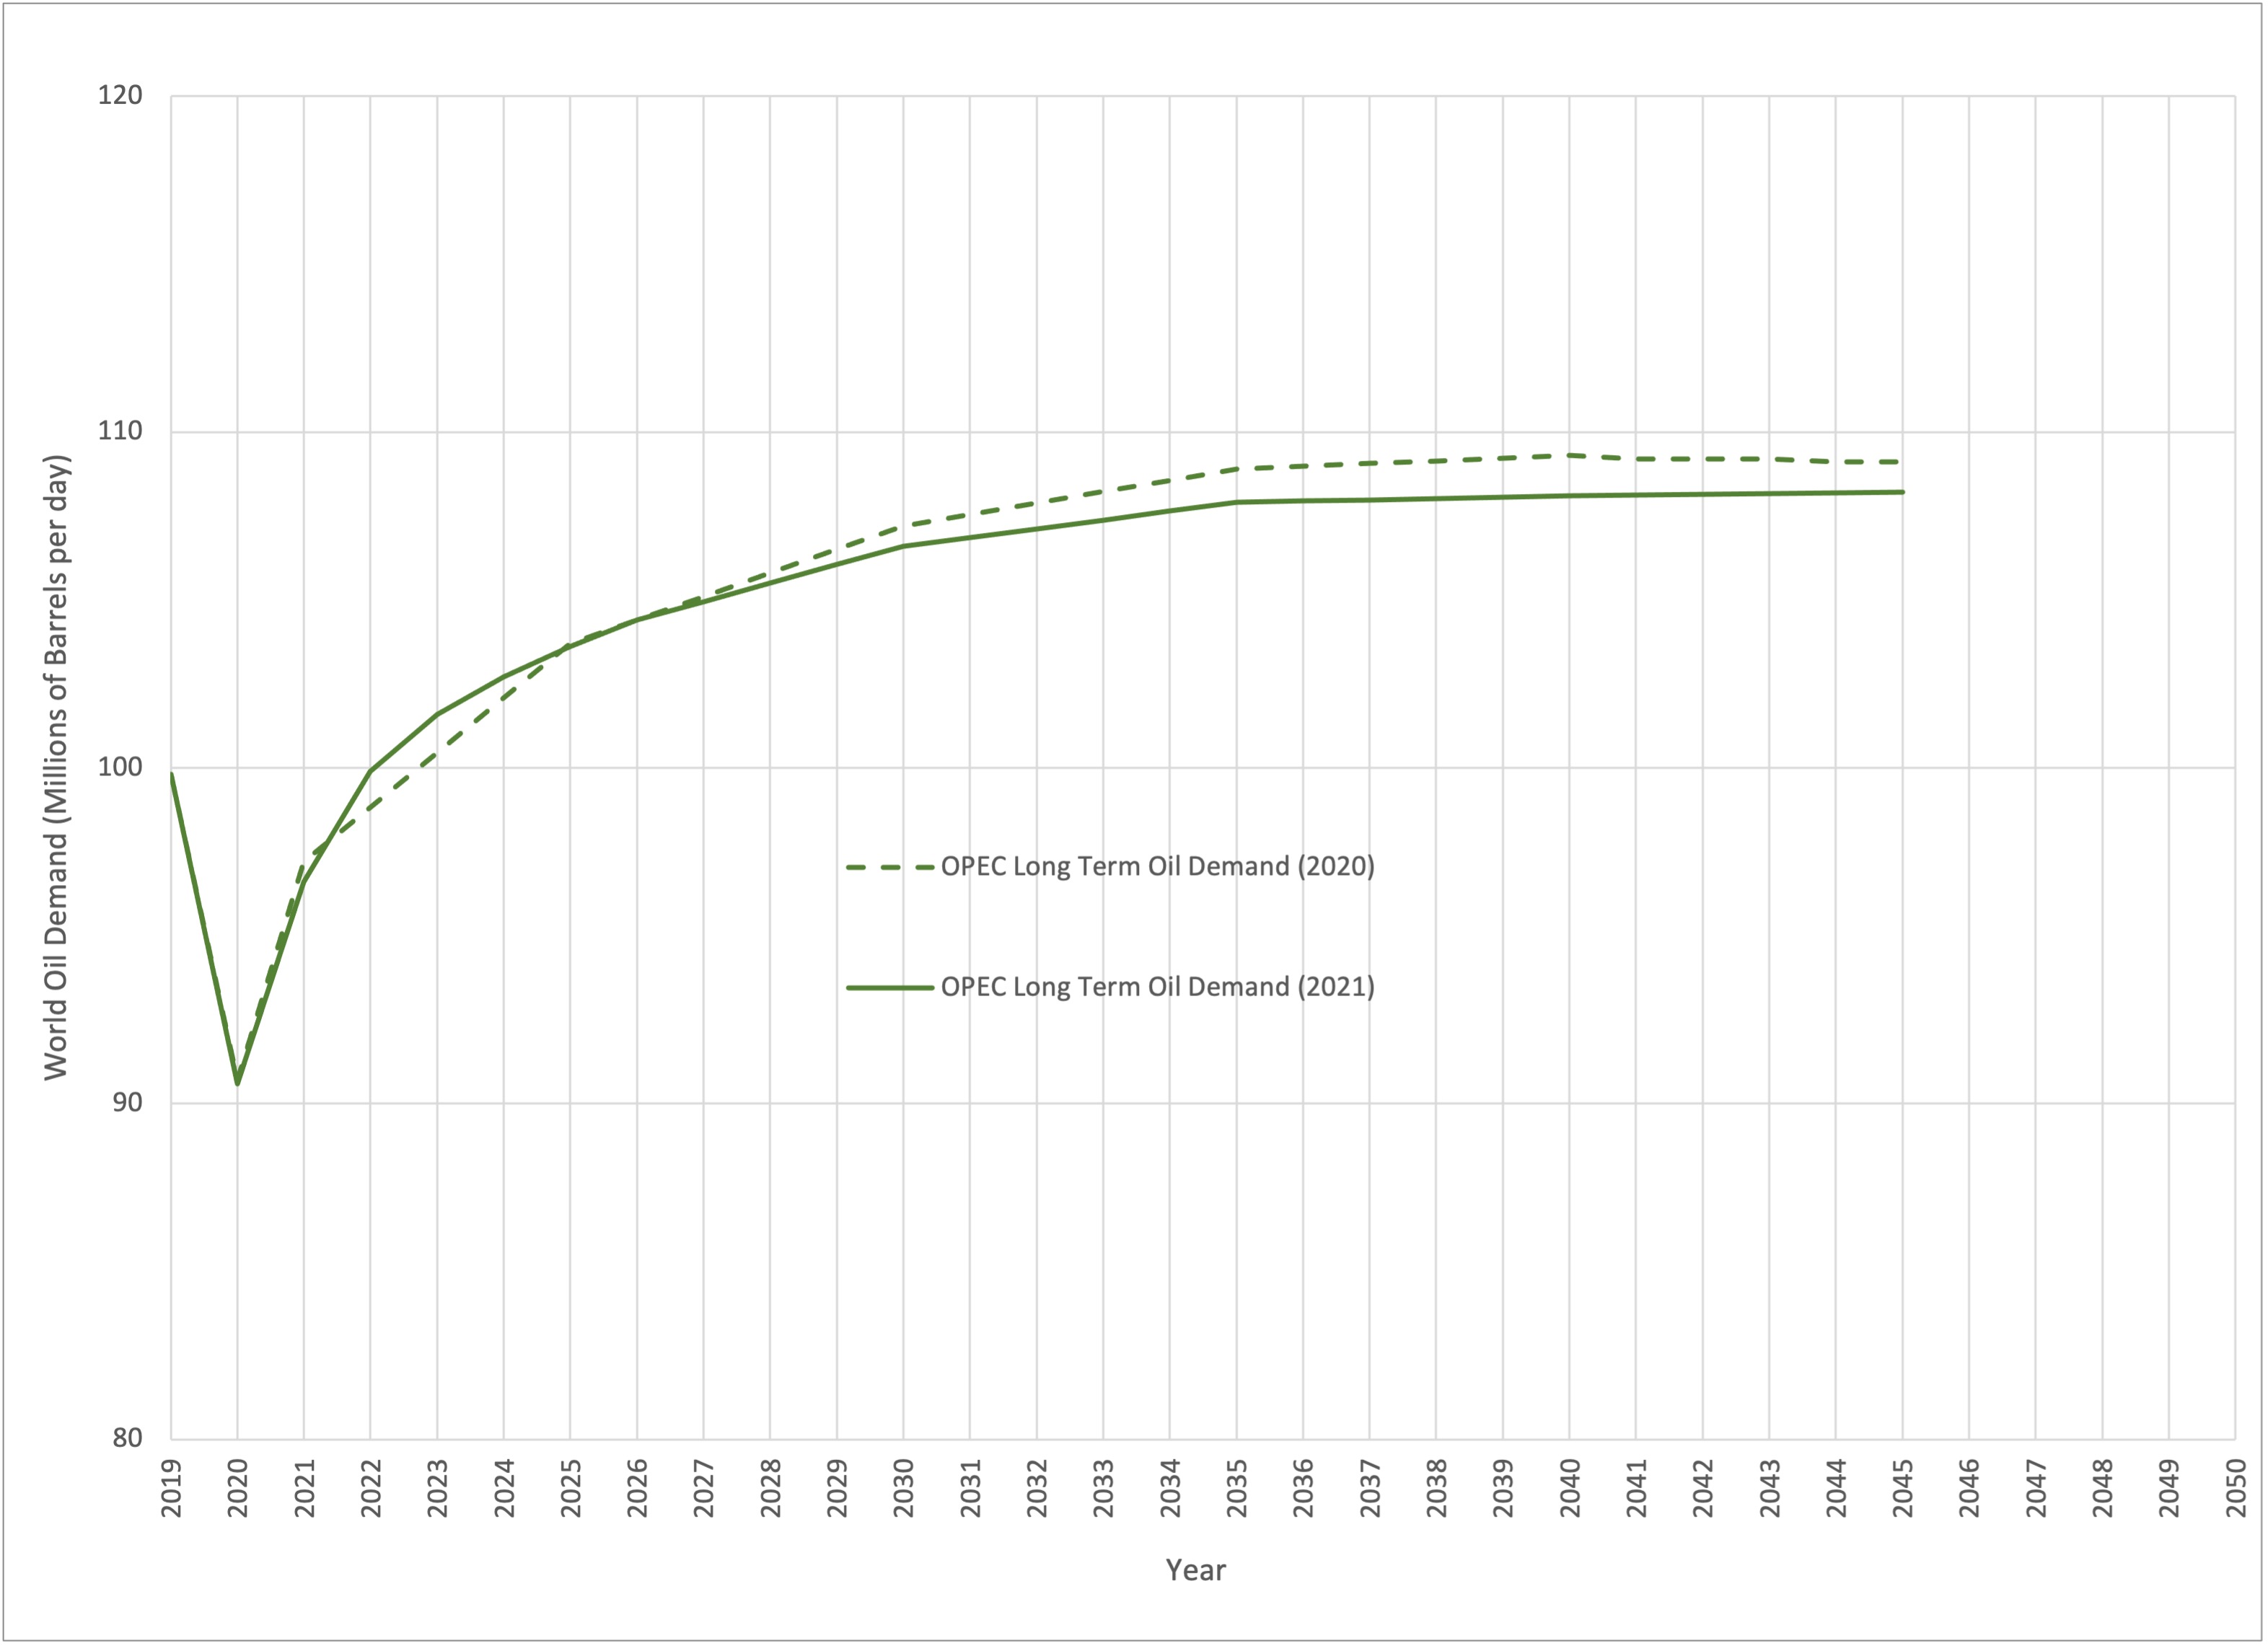
Figure 2 - OPEC Long Term Oil Demand Forecasts
As Figure 2 shows, OPEC have downgraded their demand estimate through 2030 and 2045 by nearly 1 MMbbl/day. In OPEC’s commentary on range, they see demand risk as being heavily skewed to the downside, with demand in 2045 of 100 MMbbl/day possible depending on the evolution of government policy.
Energy Information Administration (EIA)
The EIA, which was the most optimistic agency in terms of demand predictions, has not published long term oil demand forecast since 2019, so their Annual Energy Outlook was received with great interest. Not to be outdone by the IEA, the EIA published five scenarios. The reference case is similar to IEA Stated Polices or the OPEC forecast, in that it is based on current government policy. Aside from this, the EIA scenarios don’t look at any policy changes, but instead look at economic growth and oil price – there are high and low growth scenarios and high and low price scenarios. The high and low growth cases represent the boundaries, so we will focus on these, together with the reference case. A comparison of EIA long term oil demand forecasts is shown in Figure 3, below.

Figure 3 – EIA Long Term Oil Demand Forecasts
The EIA supply and demand data is consistently around 1 MMbbl/day or so above IEA and OPEC, probably because they use a slightly different definition of oil. The big surprise here is not just the direction of the revision, but its extent. In the reference case, for example, the EIA estimate for 2050 has jumped from 117.6 MMbbl/day to 125.9 MMbbl/day. In the high case, oil demand in 2050 is 150% of the 2019 level. Even in their most pessimistic case, oil demand climbs to the middle of this decade and then rises slowly to 105.7 MMbbl/day, not far short of the OPEC and IEA reference cases.
Long Term Oil Demand Comparison
Figure 4, below, shows the central forecasts of each agency on the same chart – IEA Stated Policies and Announced Pledges, the OPEC forecast and the EIA reference case.

Figure 4 – Long Term Oil Demand Comparisons
(Based on data from International Energy Agency (2021), as modified by Glenloch Energy)
The first thing to note is that, except for Announced Pledges, all these forecasts are built on the same underlying policy assumptions. OPEC and the IEA Stated Policy forecasts are now near identical, whereas the EIA reference case continues on a much steeper trajectory beyond 2030. One explanation for this could be economic growth, but on further inspection this does not seem to be the case. The IEA report assumes a global average of 3.6% to 2030 and 2.7% to 2050. The OPEC report assumes 3.8% to 2026, 3.1% to 2035 and 2.7% to 2045. The EIA reference case assumes 2.8% throughout the forecast period.
Another explanation is that, while the forecasts are based in the same policies, there may be differences in how each agency assesses the impact of a given policy. This may be closer to the mark. If we look at the assumptions concerning EV penetration, for example, these are quite different. In the EIA reference case, what they define at ‘Alternative Fuel Cars’, which is everything except traditional gasoline and diesel, will make up 11.4% of US new vehicle sales in 2030. Of that, only 30%, or 3.4% of total sales will be true battery EV’s, with most of the rest being flex-fuel or hybrids. The EIA have downgraded their estimate of EV sales from last year’s outlook. The IEA Stated Policies scenario on the other hand, assumes that the global stock of EV’s has reached 135 million by 2030. To achieve this level of penetration, we estimate that EV’s would have to constitute 40% of global car sales by 2030. While the EIA is focused on the US market only, as an advanced economy we would expect the US to have to have EV sales at this level for the world to have a chance of hitting 40%. This is one area where the IEA and EIA are predicting very different outcomes from the same policies.
The OPEC and IEA Stated Policies forecasts are now close to identical, and the bottom of the OPEC range sits close to the IEA’s Announced Pledges forecast through 2030 at least. The general direction seems to be that, as a minimum we will see oil demand continue to climb through the rest of the decade, and in the reference cases it will continue to climb for the next 30 years. In the EIA case, there is potential that demand growth could be strong over that period. In any case it doesn’t look we have reached peak oil yet and barring some substantial policy changes.
Oil Supply and Demand
The IEA (4) have raised their 2021 and 2022 demand estimates, with the change driven mainly by the expectation that elevated gas prices will drive fuel switching during the Northern Hemisphere winter. The IEA now thinks oil demand with reach 96.5 MMbbl/day this year and rise another 3.3 MMbbl/day in 2022 to exceed the pre-pandemic 2019 peak. This means all major energy agencies are predicting renewed oil demand growth next year. Meanwhile OPEC (5) shaved 160,000 bbl/day off their 2021 demand forecast in response to reduced estimates of demand from earlier in the year. This brings their 2021 demand estimate to 96.6 MMbbl/day. The EIA (6) boosted their demand estimate for 2021 to 97.47 MMbbl/day.
On the supply side, the Biden administration made a renewed appeal to OPEC+ to boost demand (7) to rein in rising prices, but at their 4th October meeting, OPEC+ decided to maintain their planned pace, returning another 400,000 bbl/day to market in November (8). The OPEC General Secretary, Mohammed Barkindo, issued a warning that the world needed to boost investment in new oil and gas development, or it would need to brace for energy shortages (9), a call echoed by the Economist in its prediction that fossil fuel investment would continue to decline (10). This call was greeted in the affirmative with pledges from China, Saudi Arabia, Russia, and the United Arab Emirates (UAE) to invest in expanding supply capacity in the medium term. Meanwhile, US Interior Secretary Deb Haaland suggested that limits to fossil fuel extraction in the US were coming (11).
Our forecast reflects the view shared by General Secretary Barkindo as demand outstrips supply for the remainder of our forecast period, as shown in Figure 5.

Figure 5 - Supply and Demand Surplus Forecast
Oil Storage
We estimate global oil inventory drawdowns of 119 MMbbl in the first half of 2021, rising to 318 MMbbl in the second half of the year as demand recovers. This represents a sharper drawdown than we anticipated last month.
Figure 6 shows global storage capacity and inventories. If supply and demand follow the current forecast, global inventories will still be slightly above the five year average by year end, falling below the five year average in 2022, with the deficit accelerating through 2023 and 2024.
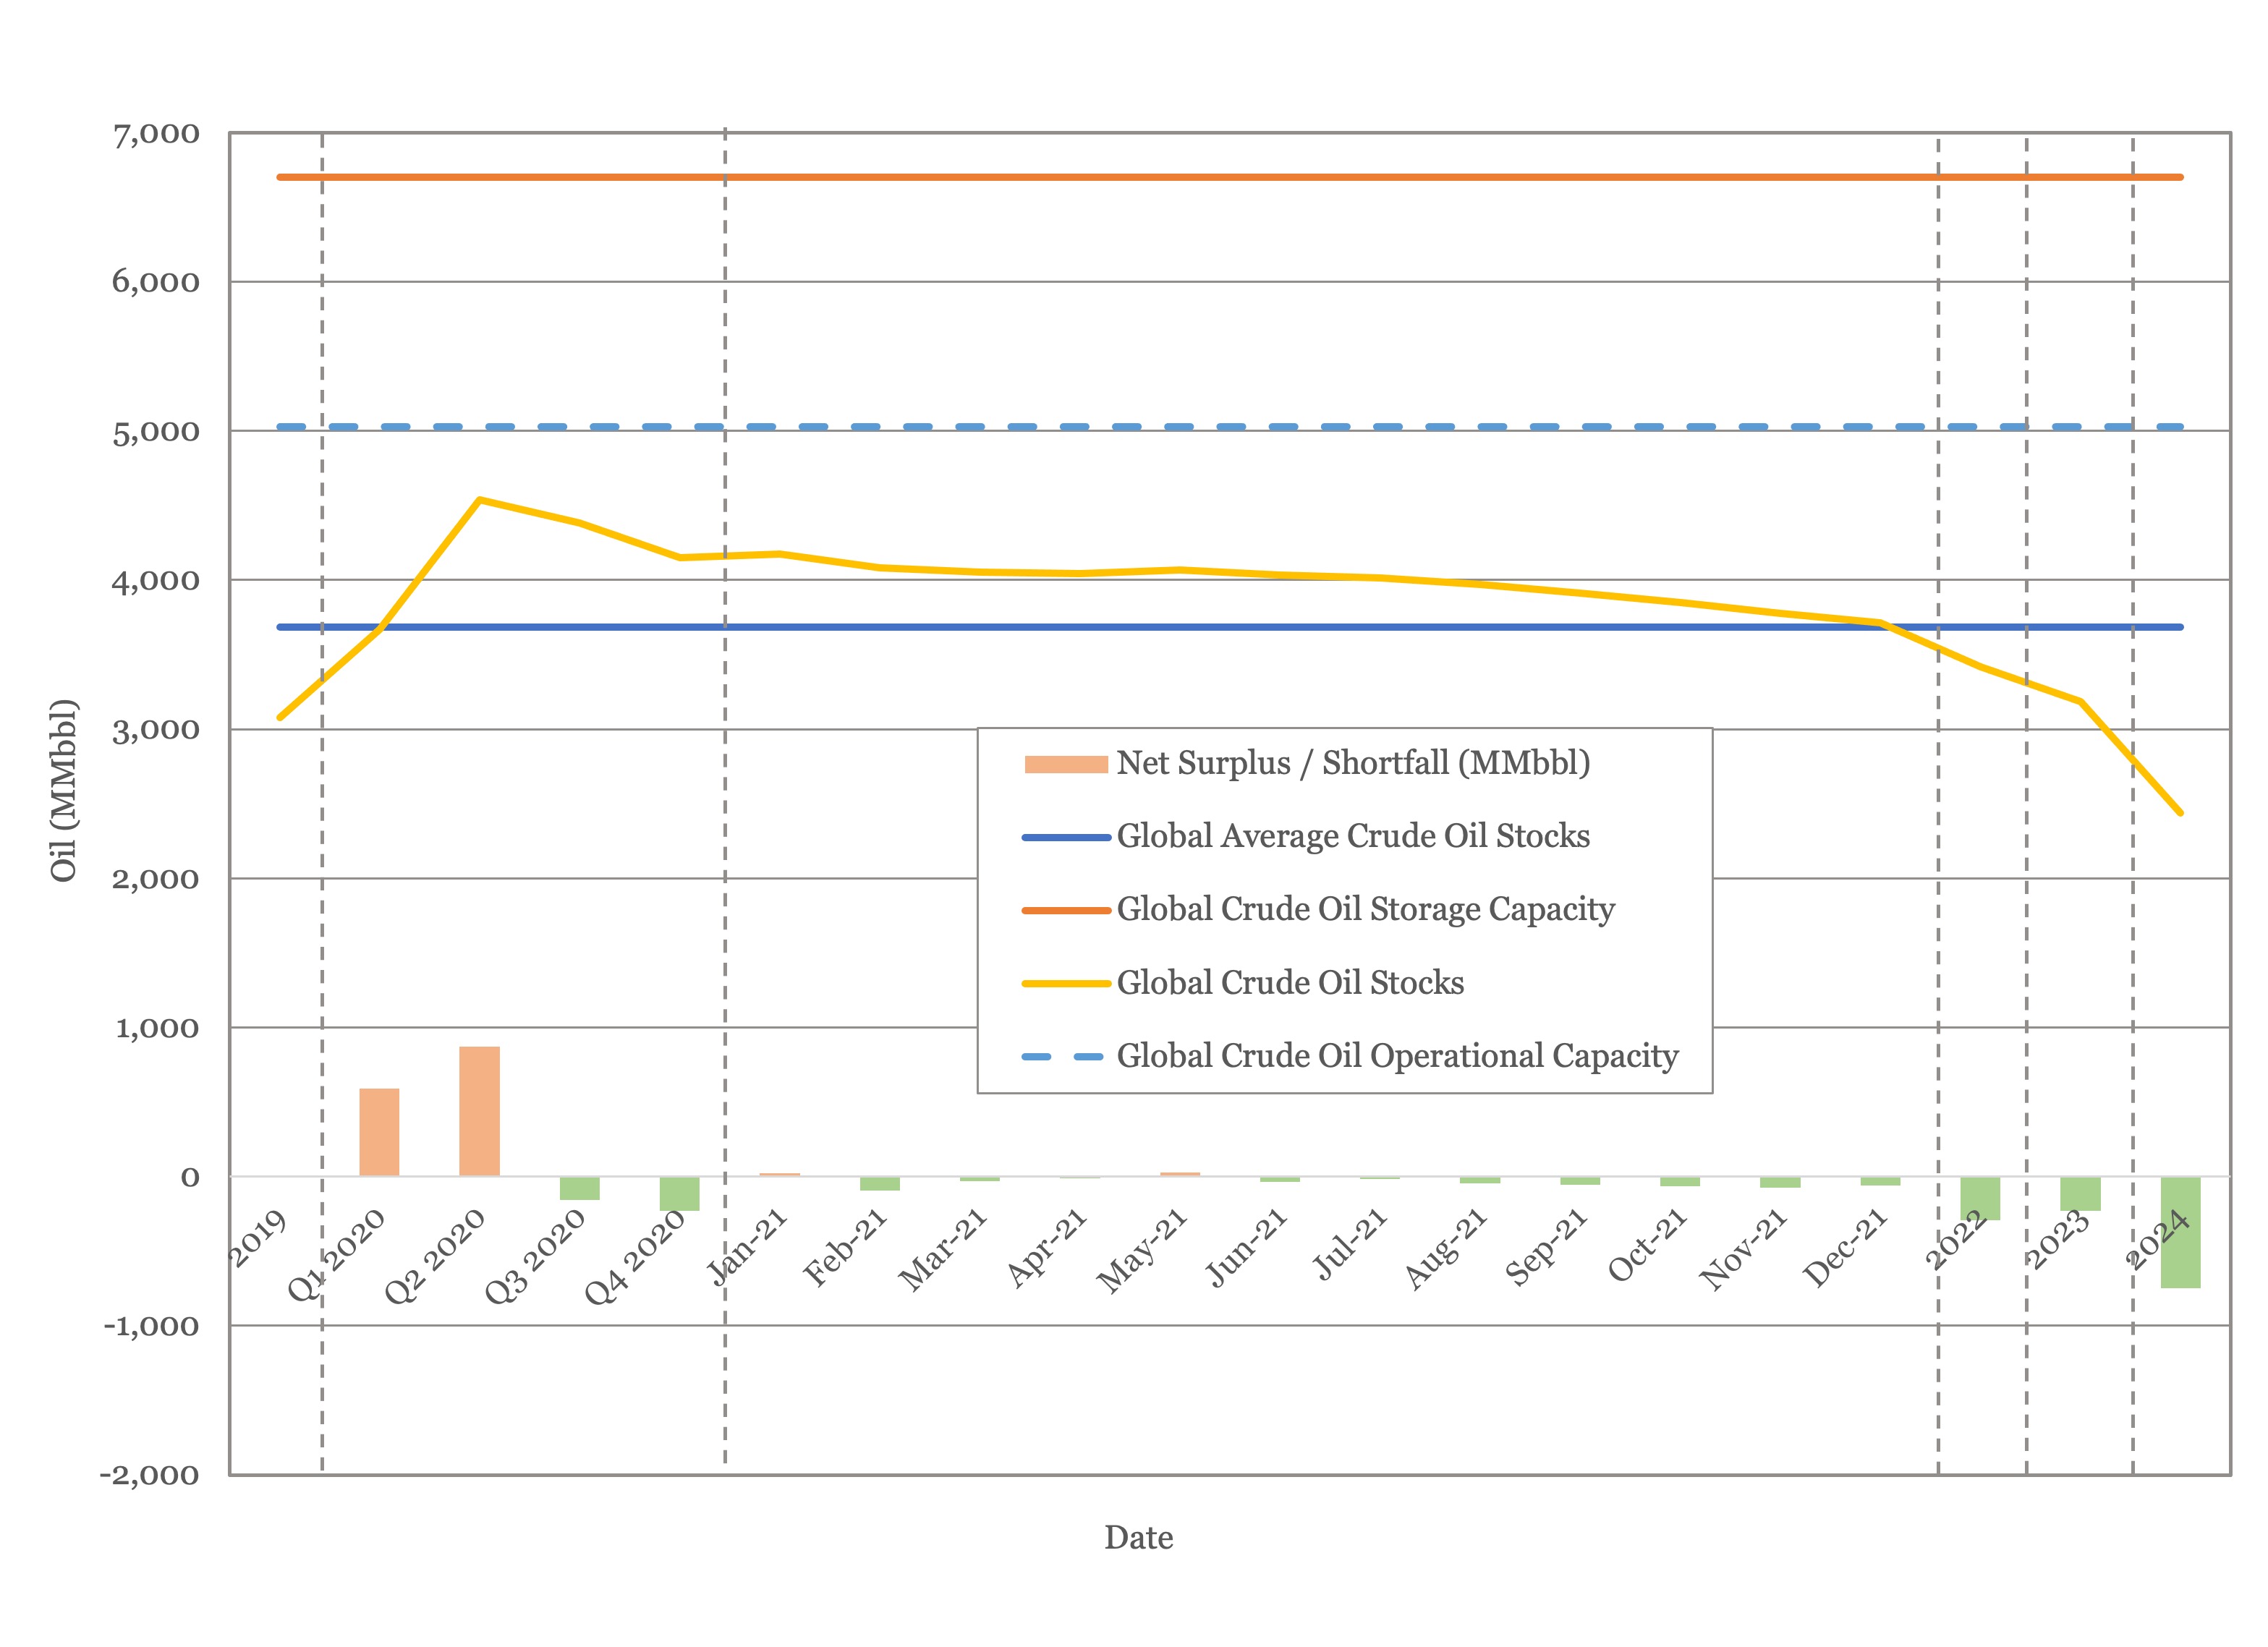
Figure 6 - Global Storage Chart
Oil Prices
Both Brent and WTI spot prices rebounded strongly after last month’s decline, with Brent breaking through $85/bbl earlier this month and both Brent and WTI settling above $80/bbl at the time of writing. The EIA has raised their price estimate for Brent for the fourth quarter by $10/bbl to $81/bbl.
The same pattern has been reflected in the futures market, with both Brent and WTI futures showing their highest prices of the year through to 2025.
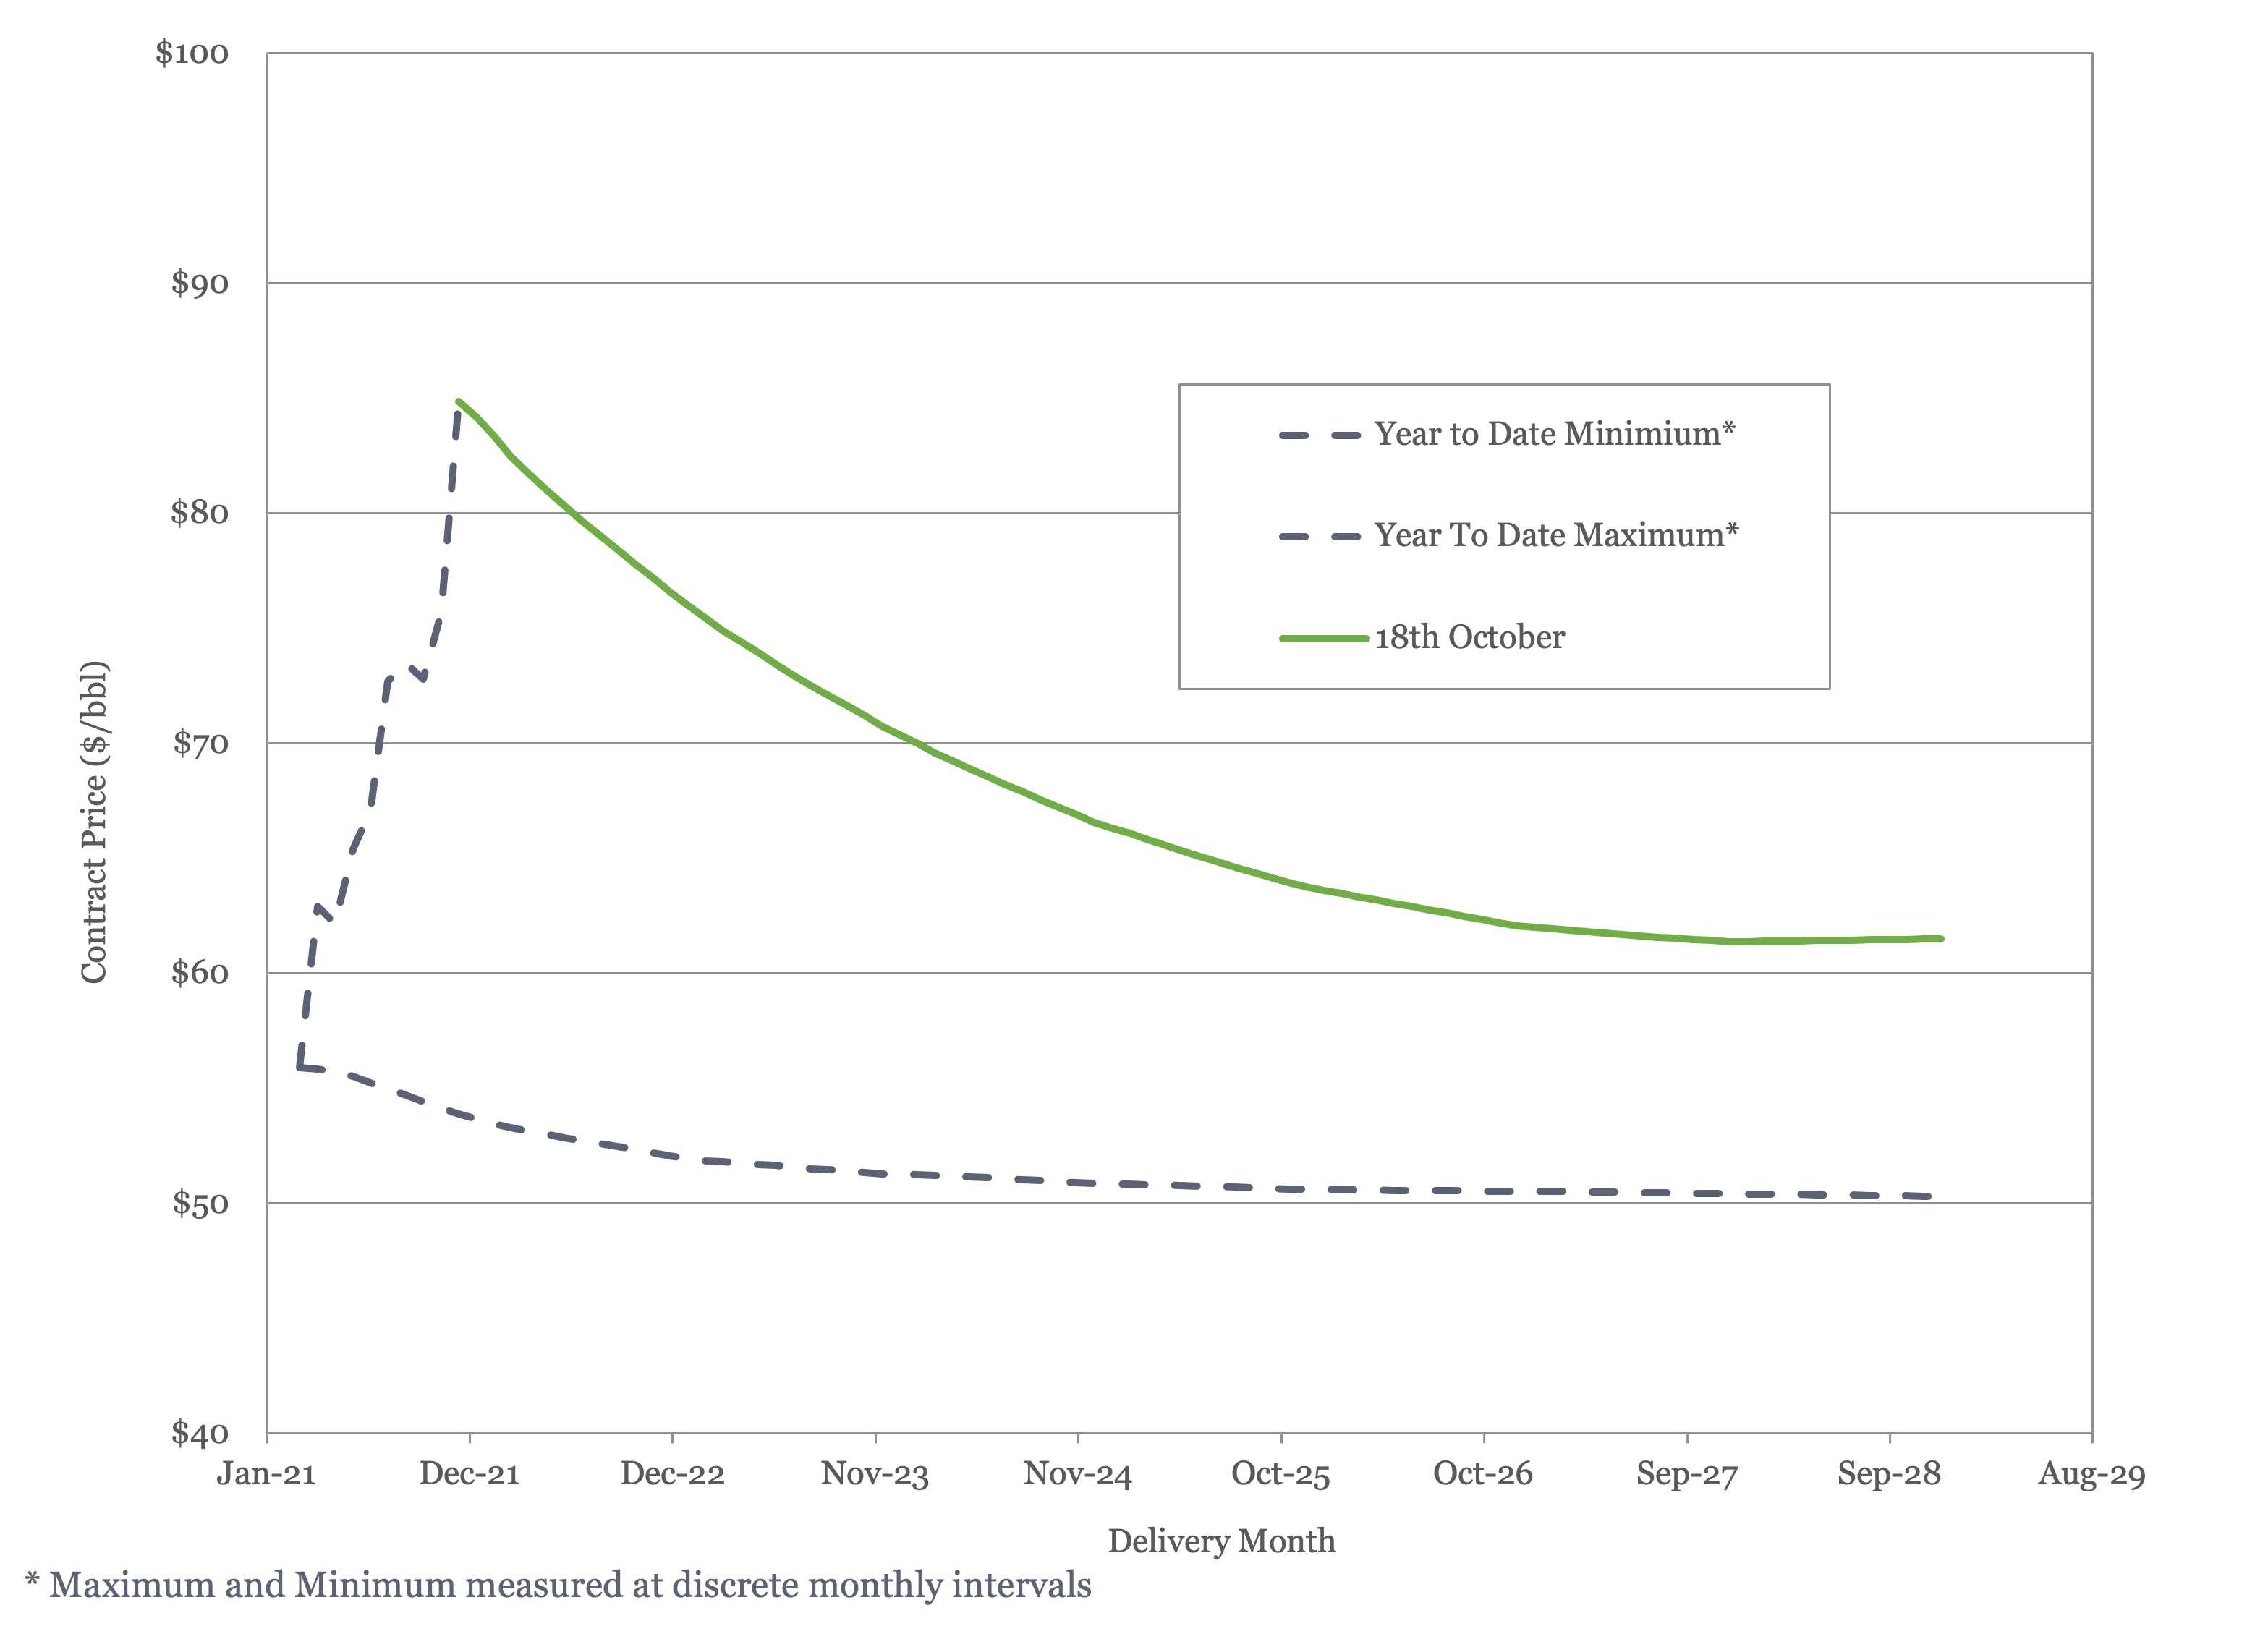
Figure 7 - Brent Crude Oil Futures

Figure 8 - WTI Crude Oil Futures
This sudden snapback suggests that last month’s concerns about the impact of the Delta variant, while resulting in small downgrades to this year’s demand estimates, may have been oversold.
US Activity
The US land oil rig count continued to climb this month rising from 406 on the 17th of September to 431 on the 18th of October. While we expect the rig count to continue to rise through this year and next, there is still no indication of an acceleration in activity.

Figure 9 - US Land Oil Rig Count
Estimates of 2022 activity levels are starting to appear and US onshore drilling and completion activity could see a 20% rise in expenditure. However, this is unlikely to relate directly to a 20% rise in activity given inflation.
(1) “World Energy Outlook 2021”, International Energy Agency, October 2021
(2) “World Oil Outlook 2021”, Organisation of the Petroleum Exporting Countries, October 2021
(3) “Annual Energy Outlook 2021”, Energy Information Administration, October 2021
(4) Oil Market Report – September 2021, International Energy Agency
(5) “OPEC Monthly Oil Market Report”, Organization of the Petroleum Exporting Countries, October 13th, 2021.
(6) Short Term Energy Outlook (STEO), October 13th 2021, U.S. Energy Information Administration.
(7) “Biden renews OPEC outreach as oil prices climb 10% in September”, Julia Fanzeres, World Oil, September 30th, 2021.
(8) 21st OPEC and Non OPEC Ministerial Meeting, October 4th, 2021.
(9) “OPEC Boss Says World Can’t Afford to Underinvest in Oil”, Benoit Faucon and Summer Said, The Wall Street Journal, October 1st, 2021
(10) “The age of fossil-fuel abundance is dead”, The Economist, October 9th, 2021, edition.
(11) “Interior’s Haaland Hints at Limits on Fossil Fuel Extraction”, Jennifer A Dlouhy, Bloomberg Green, September 23rd, 2021.


Oil Market Forecast - October 2021
Summary
It’s been an eventful month in the oil industry, with rising gas prices and an energy crunch bringing energy security back onto the global agenda. The combination of factors that has European nations bringing coal and oil fired power back on line and looking for ways to shield their citizens from soaring energy prices comes just before the start of the UN Climate Change Conference in Glasgow. The COP 26 starts at the end of this month, and in preparation all the major forecasting agencies have updated their long term oil demand scenarios. We start by examining those, before looking at medium term supply and demand, storage, prices, and US activity.
A few key points:
- The IEA and EIA have both raised their reference estimates of long term oil demand, OPEC cut their estimate slightly.
- The IEA Stated Policies scenario and OPEC’s long term demand forecast are now close to identical, the EIA reference case predicts much higher oil demand.
- The reference case long term scenarios from each agency show oil demand growth through 2045 or 2050; barring substantial national policy changes oil demand is predicted to continue rising for the next 30 years.
- The IEA upgraded its demand estimate for 2021 and 2022; all forecasting agencies are now predicting 2022 oil demand above pre-pandemic levels.
- There were calls from the OPEC General Secretary and a warning from the Economist that current levels of investment in oil & gas infrastructure were not sufficient to meet demand, increasing the risk of volatility in energy prices.
- We estimate that global storage will have fallen to pre-pandemic levels by the end of the year and expect it to continue falling given the tight market.
- Prices reached new post-pandemic records and the futures market for Brent and WTI reached its highest level for the year.
- The US land oil rig count reached 431.
Long Term Oil Demand
The UN Climate Change Conference (COP26) is scheduled to start at the end of this month and in preparation the major energy agencies have issued updated long term oil demand forecasts. The IEA issued their World Energy Outlook 2021 (1), which includes updates to their Stated Policies, Announced Pledges and Sustainable Development scenarios. OPEC published their World Oil Outlook 2021 (2), which provides their estimate of demand through to 2045. Finally, the EIA published their first long term oil demand forecast update since 2019, in their Annual Energy Outlook 2021 (3). We will start by looking at the update to each forecast and then compare the three to see what, if any conclusions can be drawn.
International Energy Agency (IEA)
The IEA publishes four different forecasts, all running from now to 2050. The first is Stated Policies, which is their estimate of oil demand under current national policies. The second is Announced Pledges, which includes national commitments on top of existing legislation. The third is Sustainable Development, which reflects the oil demand that would be required to limit global warming to substantially less than 2 degrees celsius. The final one is Net Zero, which reflects the oil demand required to limit global warming to 1.5 degree celsius. Stated Polices and Announced Pledges are genuine forecasts, whereas Sustainable Development and Net Zero are illustrative of what would be required to hit UN Climate Change Conference targets. Stated Polices and Sustainable Development were published last year, Stated Policies was updated in May of this year at the same time as Announced Pledges and Net Zero were launched. In their latest report, the IEA have updated Stated Policies, Announced Pledges and Sustainable Development. A comparison of IEA long term oil demand forecasts is shown in Figure 1, below.
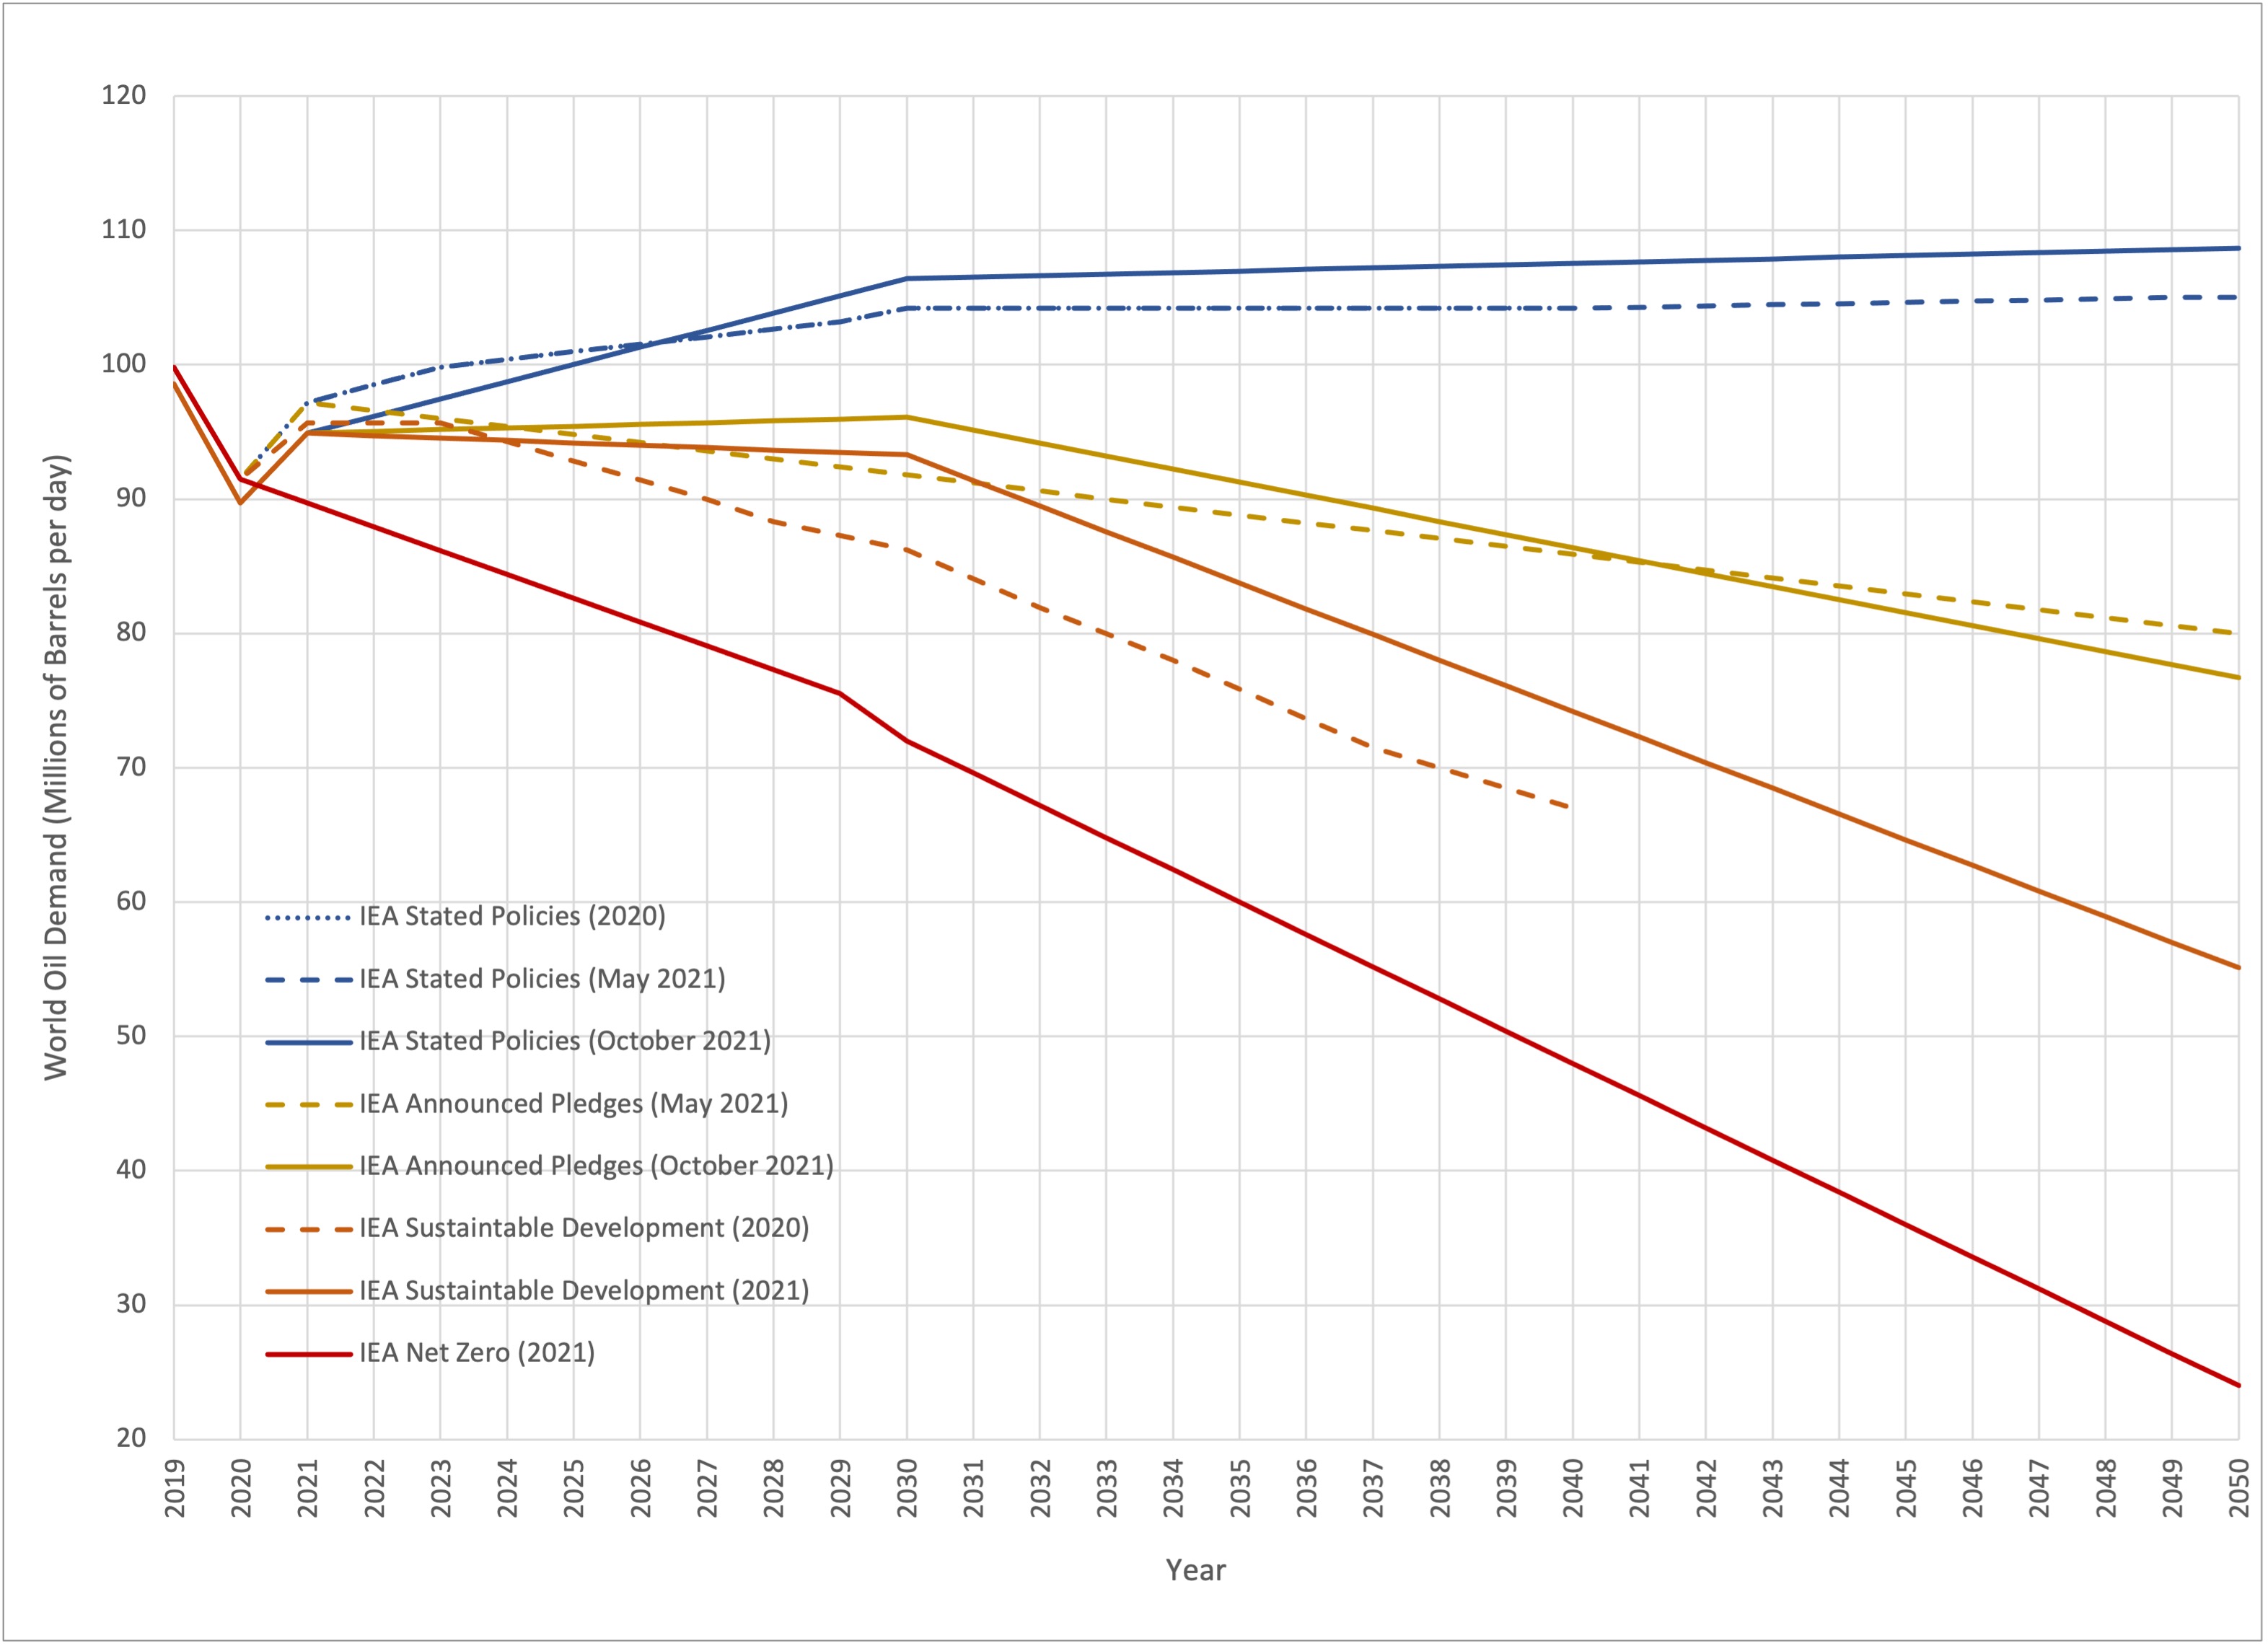
Figure 1 - – IEA Long Term Oil Demand Forecasts
(Based on data from International Energy Agency (2021), as modified by Glenloch Energy)
The first thing to note in the IEA forecast is that they seem to have downgraded historical demand. For example, in previous forecasts 2019 oil demand was 99.8 MMbbl/day and in these forecasts, it is shown as 98.6 MMbbl/day. This is probably a change to the internal definition of demand rather than a revision, as in the IEA’s latest publicly available Oil Market Report (July), 2019 demand is 99.7 MMbbl/day.
The second point to note is that long term demand in the Stated Policies case has been raised substantially, from 105 MMbbl/day in 2050 to 108.7 MMbbl/day in 2050. This contradicts the body of the IEA report, which makes the point repeatedly that oil demand will fall by 2050 in all scenarios. It turns out that both can be true. In this report the IEA have broken out biofuels under their definition of liquids, so when they talk about oil demand in the body of the text, they mean oil excluding biofuels, which they have traditionally grouped under oil demand. In the Stated Policies scenario, for example oil demand (excluding biofuels) rises to 103 MMbbl/day in 2030 and stays at 103 MMbbl/day in 2050. Under the same scenario, biofuels rise from 2 MMbbl/day in 2019 to 3.5 MMbbl/day in 2030 to 5.7 MMbbl/day in 2050. How realistic is this?
About half of the global demand for biofuels comes from the US, where ethanol is blended into gasoline, under a scheme that was originally formulated during the oil shocks of the 1970’s to bolster US energy security but has since become a hostage to special interests. The EIA, in their latest report, has biofuel demand in the US essentially flat through 2050 as there is no prospect of repeal, but no economic or environmental incentive for expanding the scheme. The IEA Stated Policies scenario assumes that ethanol use will double over the next 10 years.
The remainder of the growth comes from advanced biofuels, which are currently very expensive – the IEA quotes production costs of $85 - $160 per barrel. To quote the IEA report, “Advanced biofuels are produced from non-food crop feedstocks, result in significantly fewer greenhouse gas emissions than fossil fuels, do not compete with food for agricultural land and do not adversely affect sustainability.”, so they would mitigate the problems with ethanol. However, there is currently no global demand for advanced biofuels, presumable due to their cost.
Net Zero, which has oil demand falling to 24 MMbbl/day in 2050, was discussed in our June Oil Market Forecast and is not seen as being a realistic scenario. The same is true of Sustainable Development – to realize this outcome oil demand would have to start falling now and keep falling, which runs counter to all medium term demand forecasts including the IEA’s.
Organisation of the Petroleum Exporting Countries (OPEC)
The OPEC update is the most straightforward. OPEC has a single forecast, which is based on current national policies, and provides some narrative guidance on range. A comparison of the OPEC long term oil demand forecasts is shown in Figure 2, below.

Figure 2 - OPEC Long Term Oil Demand Forecasts
As Figure 2 shows, OPEC have downgraded their demand estimate through 2030 and 2045 by nearly 1 MMbbl/day. In OPEC’s commentary on range, they see demand risk as being heavily skewed to the downside, with demand in 2045 of 100 MMbbl/day possible depending on the evolution of government policy.
Energy Information Administration (EIA)
The EIA, which was the most optimistic agency in terms of demand predictions, has not published long term oil demand forecast since 2019, so their Annual Energy Outlook was received with great interest. Not to be outdone by the IEA, the EIA published five scenarios. The reference case is similar to IEA Stated Polices or the OPEC forecast, in that it is based on current government policy. Aside from this, the EIA scenarios don’t look at any policy changes, but instead look at economic growth and oil price – there are high and low growth scenarios and high and low price scenarios. The high and low growth cases represent the boundaries, so we will focus on these, together with the reference case. A comparison of EIA long term oil demand forecasts is shown in Figure 3, below.
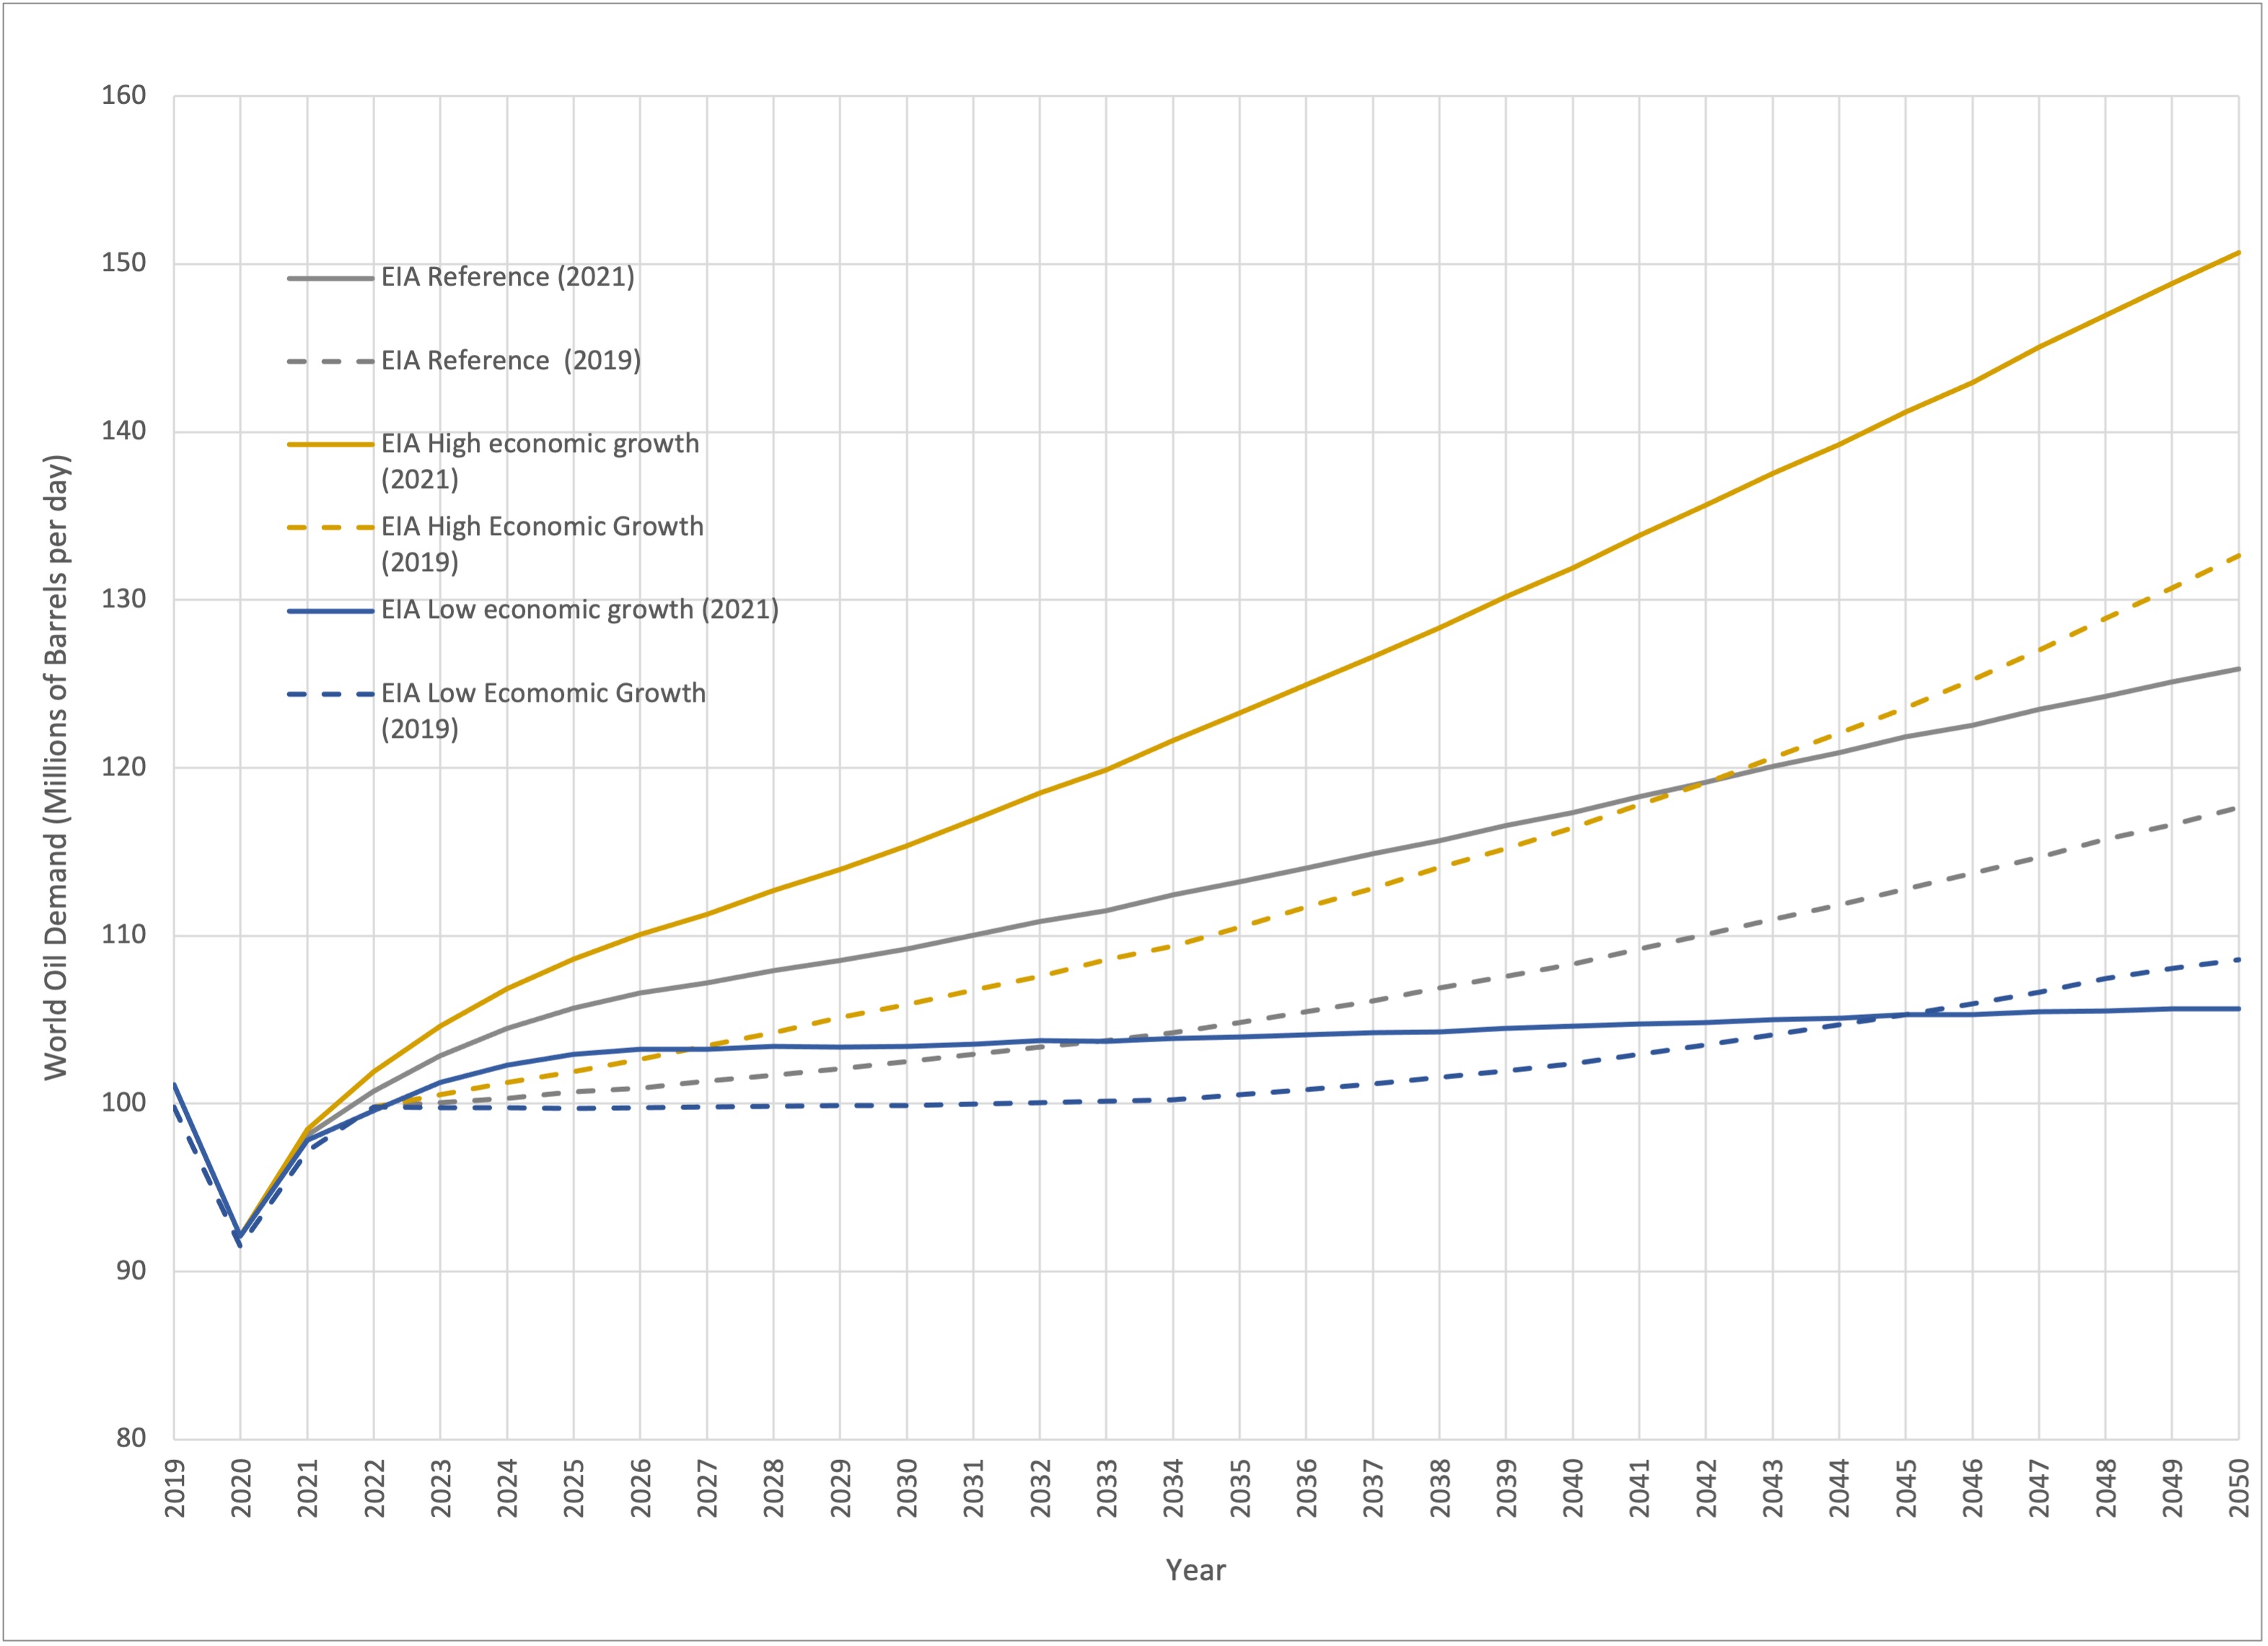
Figure 3 – EIA Long Term Oil Demand Forecasts
The EIA supply and demand data is consistently around 1 MMbbl/day or so above IEA and OPEC, probably because they use a slightly different definition of oil. The big surprise here is not just the direction of the revision, but its extent. In the reference case, for example, the EIA estimate for 2050 has jumped from 117.6 MMbbl/day to 125.9 MMbbl/day. In the high case, oil demand in 2050 is 150% of the 2019 level. Even in their most pessimistic case, oil demand climbs to the middle of this decade and then rises slowly to 105.7 MMbbl/day, not far short of the OPEC and IEA reference cases.
Long Term Oil Demand Comparison
Figure 4, below, shows the central forecasts of each agency on the same chart – IEA Stated Policies and Announced Pledges, the OPEC forecast and the EIA reference case.
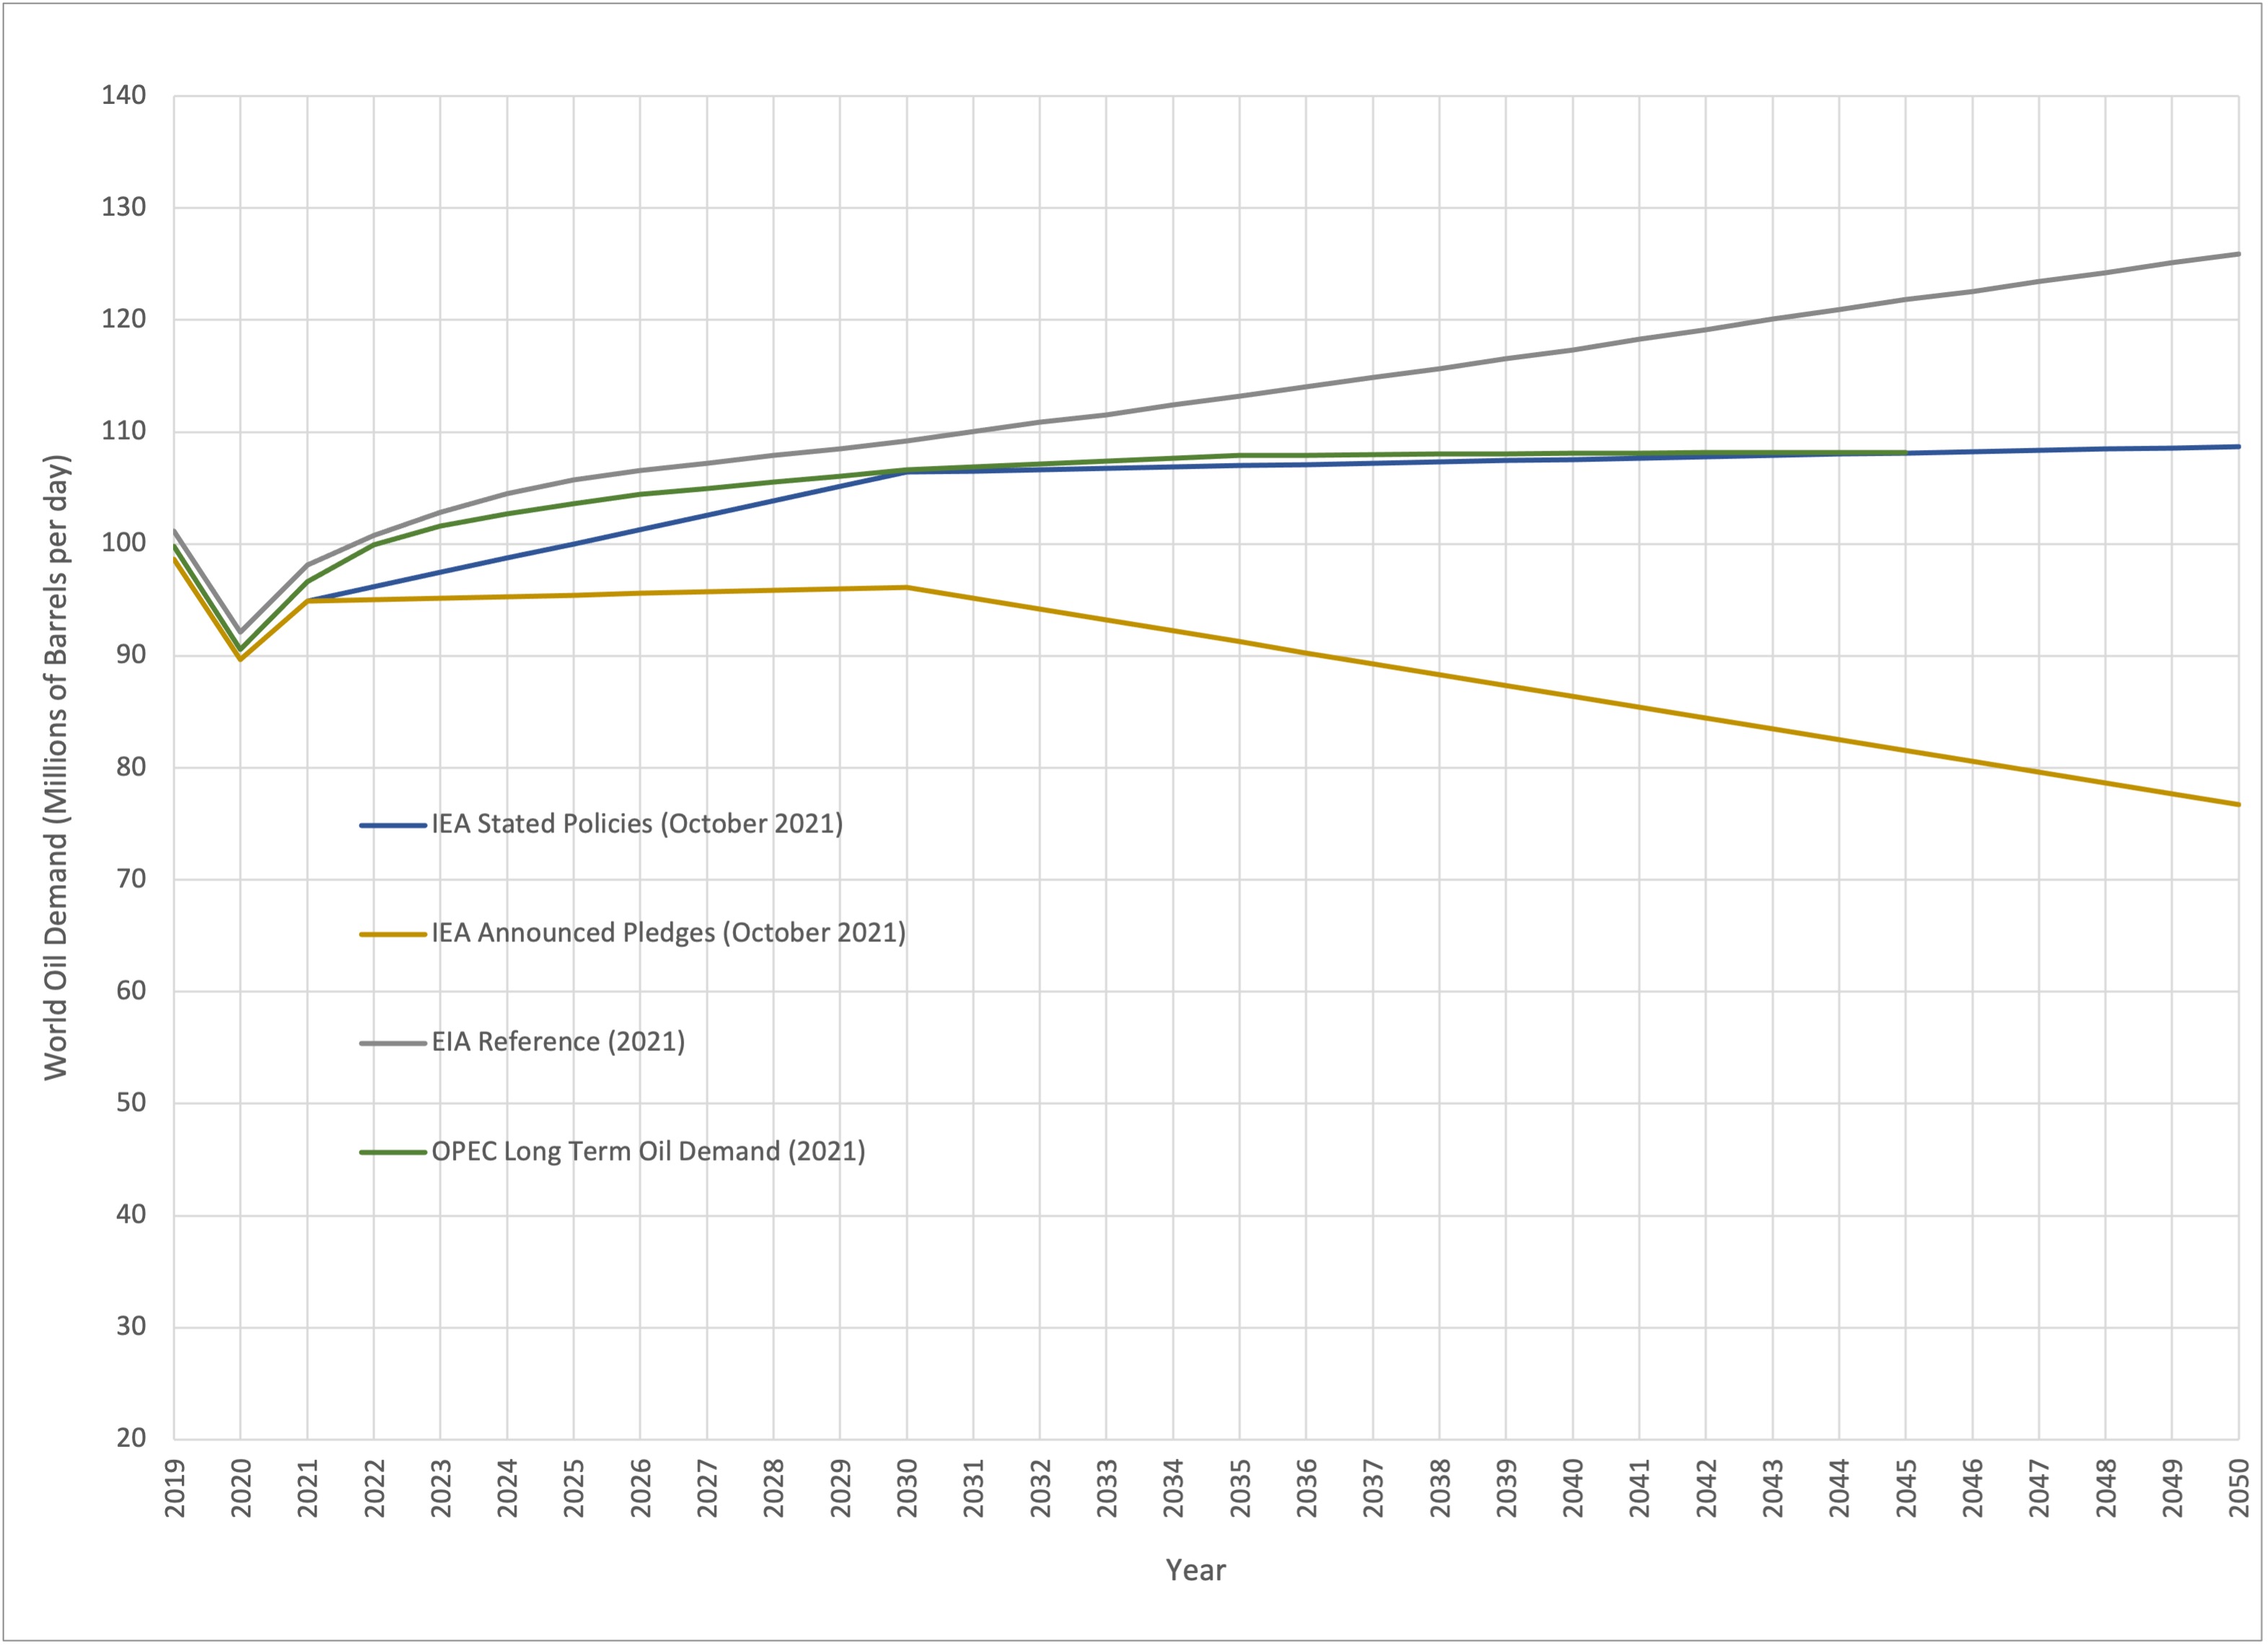
Figure 4 – Long Term Oil Demand Comparisons
(Based on data from International Energy Agency (2021), as modified by Glenloch Energy)
The first thing to note is that, except for Announced Pledges, all these forecasts are built on the same underlying policy assumptions. OPEC and the IEA Stated Policy forecasts are now near identical, whereas the EIA reference case continues on a much steeper trajectory beyond 2030. One explanation for this could be economic growth, but on further inspection this does not seem to be the case. The IEA report assumes a global average of 3.6% to 2030 and 2.7% to 2050. The OPEC report assumes 3.8% to 2026, 3.1% to 2035 and 2.7% to 2045. The EIA reference case assumes 2.8% throughout the forecast period.
Another explanation is that, while the forecasts are based in the same policies, there may be differences in how each agency assesses the impact of a given policy. This may be closer to the mark. If we look at the assumptions concerning EV penetration, for example, these are quite different. In the EIA reference case, what they define at ‘Alternative Fuel Cars’, which is everything except traditional gasoline and diesel, will make up 11.4% of US new vehicle sales in 2030. Of that, only 30%, or 3.4% of total sales will be true battery EV’s, with most of the rest being flex-fuel or hybrids. The EIA have downgraded their estimate of EV sales from last year’s outlook. The IEA Stated Policies scenario on the other hand, assumes that the global stock of EV’s has reached 135 million by 2030. To achieve this level of penetration, we estimate that EV’s would have to constitute 40% of global car sales by 2030. While the EIA is focused on the US market only, as an advanced economy we would expect the US to have to have EV sales at this level for the world to have a chance of hitting 40%. This is one area where the IEA and EIA are predicting very different outcomes from the same policies.
The OPEC and IEA Stated Policies forecasts are now close to identical, and the bottom of the OPEC range sits close to the IEA’s Announced Pledges forecast through 2030 at least. The general direction seems to be that, as a minimum we will see oil demand continue to climb through the rest of the decade, and in the reference cases it will continue to climb for the next 30 years. In the EIA case, there is potential that demand growth could be strong over that period. In any case it doesn’t look we have reached peak oil yet and barring some substantial policy changes.
Oil Supply and Demand
The IEA (4) have raised their 2021 and 2022 demand estimates, with the change driven mainly by the expectation that elevated gas prices will drive fuel switching during the Northern Hemisphere winter. The IEA now thinks oil demand with reach 96.5 MMbbl/day this year and rise another 3.3 MMbbl/day in 2022 to exceed the pre-pandemic 2019 peak. This means all major energy agencies are predicting renewed oil demand growth next year. Meanwhile OPEC (5) shaved 160,000 bbl/day off their 2021 demand forecast in response to reduced estimates of demand from earlier in the year. This brings their 2021 demand estimate to 96.6 MMbbl/day. The EIA (6) boosted their demand estimate for 2021 to 97.47 MMbbl/day.
On the supply side, the Biden administration made a renewed appeal to OPEC+ to boost demand (7) to rein in rising prices, but at their 4th October meeting, OPEC+ decided to maintain their planned pace, returning another 400,000 bbl/day to market in November (8). The OPEC General Secretary, Mohammed Barkindo, issued a warning that the world needed to boost investment in new oil and gas development, or it would need to brace for energy shortages (9), a call echoed by the Economist in its prediction that fossil fuel investment would continue to decline (10). This call was greeted in the affirmative with pledges from China, Saudi Arabia, Russia, and the United Arab Emirates (UAE) to invest in expanding supply capacity in the medium term. Meanwhile, US Interior Secretary Deb Haaland suggested that limits to fossil fuel extraction in the US were coming (11).
Our forecast reflects the view shared by General Secretary Barkindo as demand outstrips supply for the remainder of our forecast period, as shown in Figure 5.
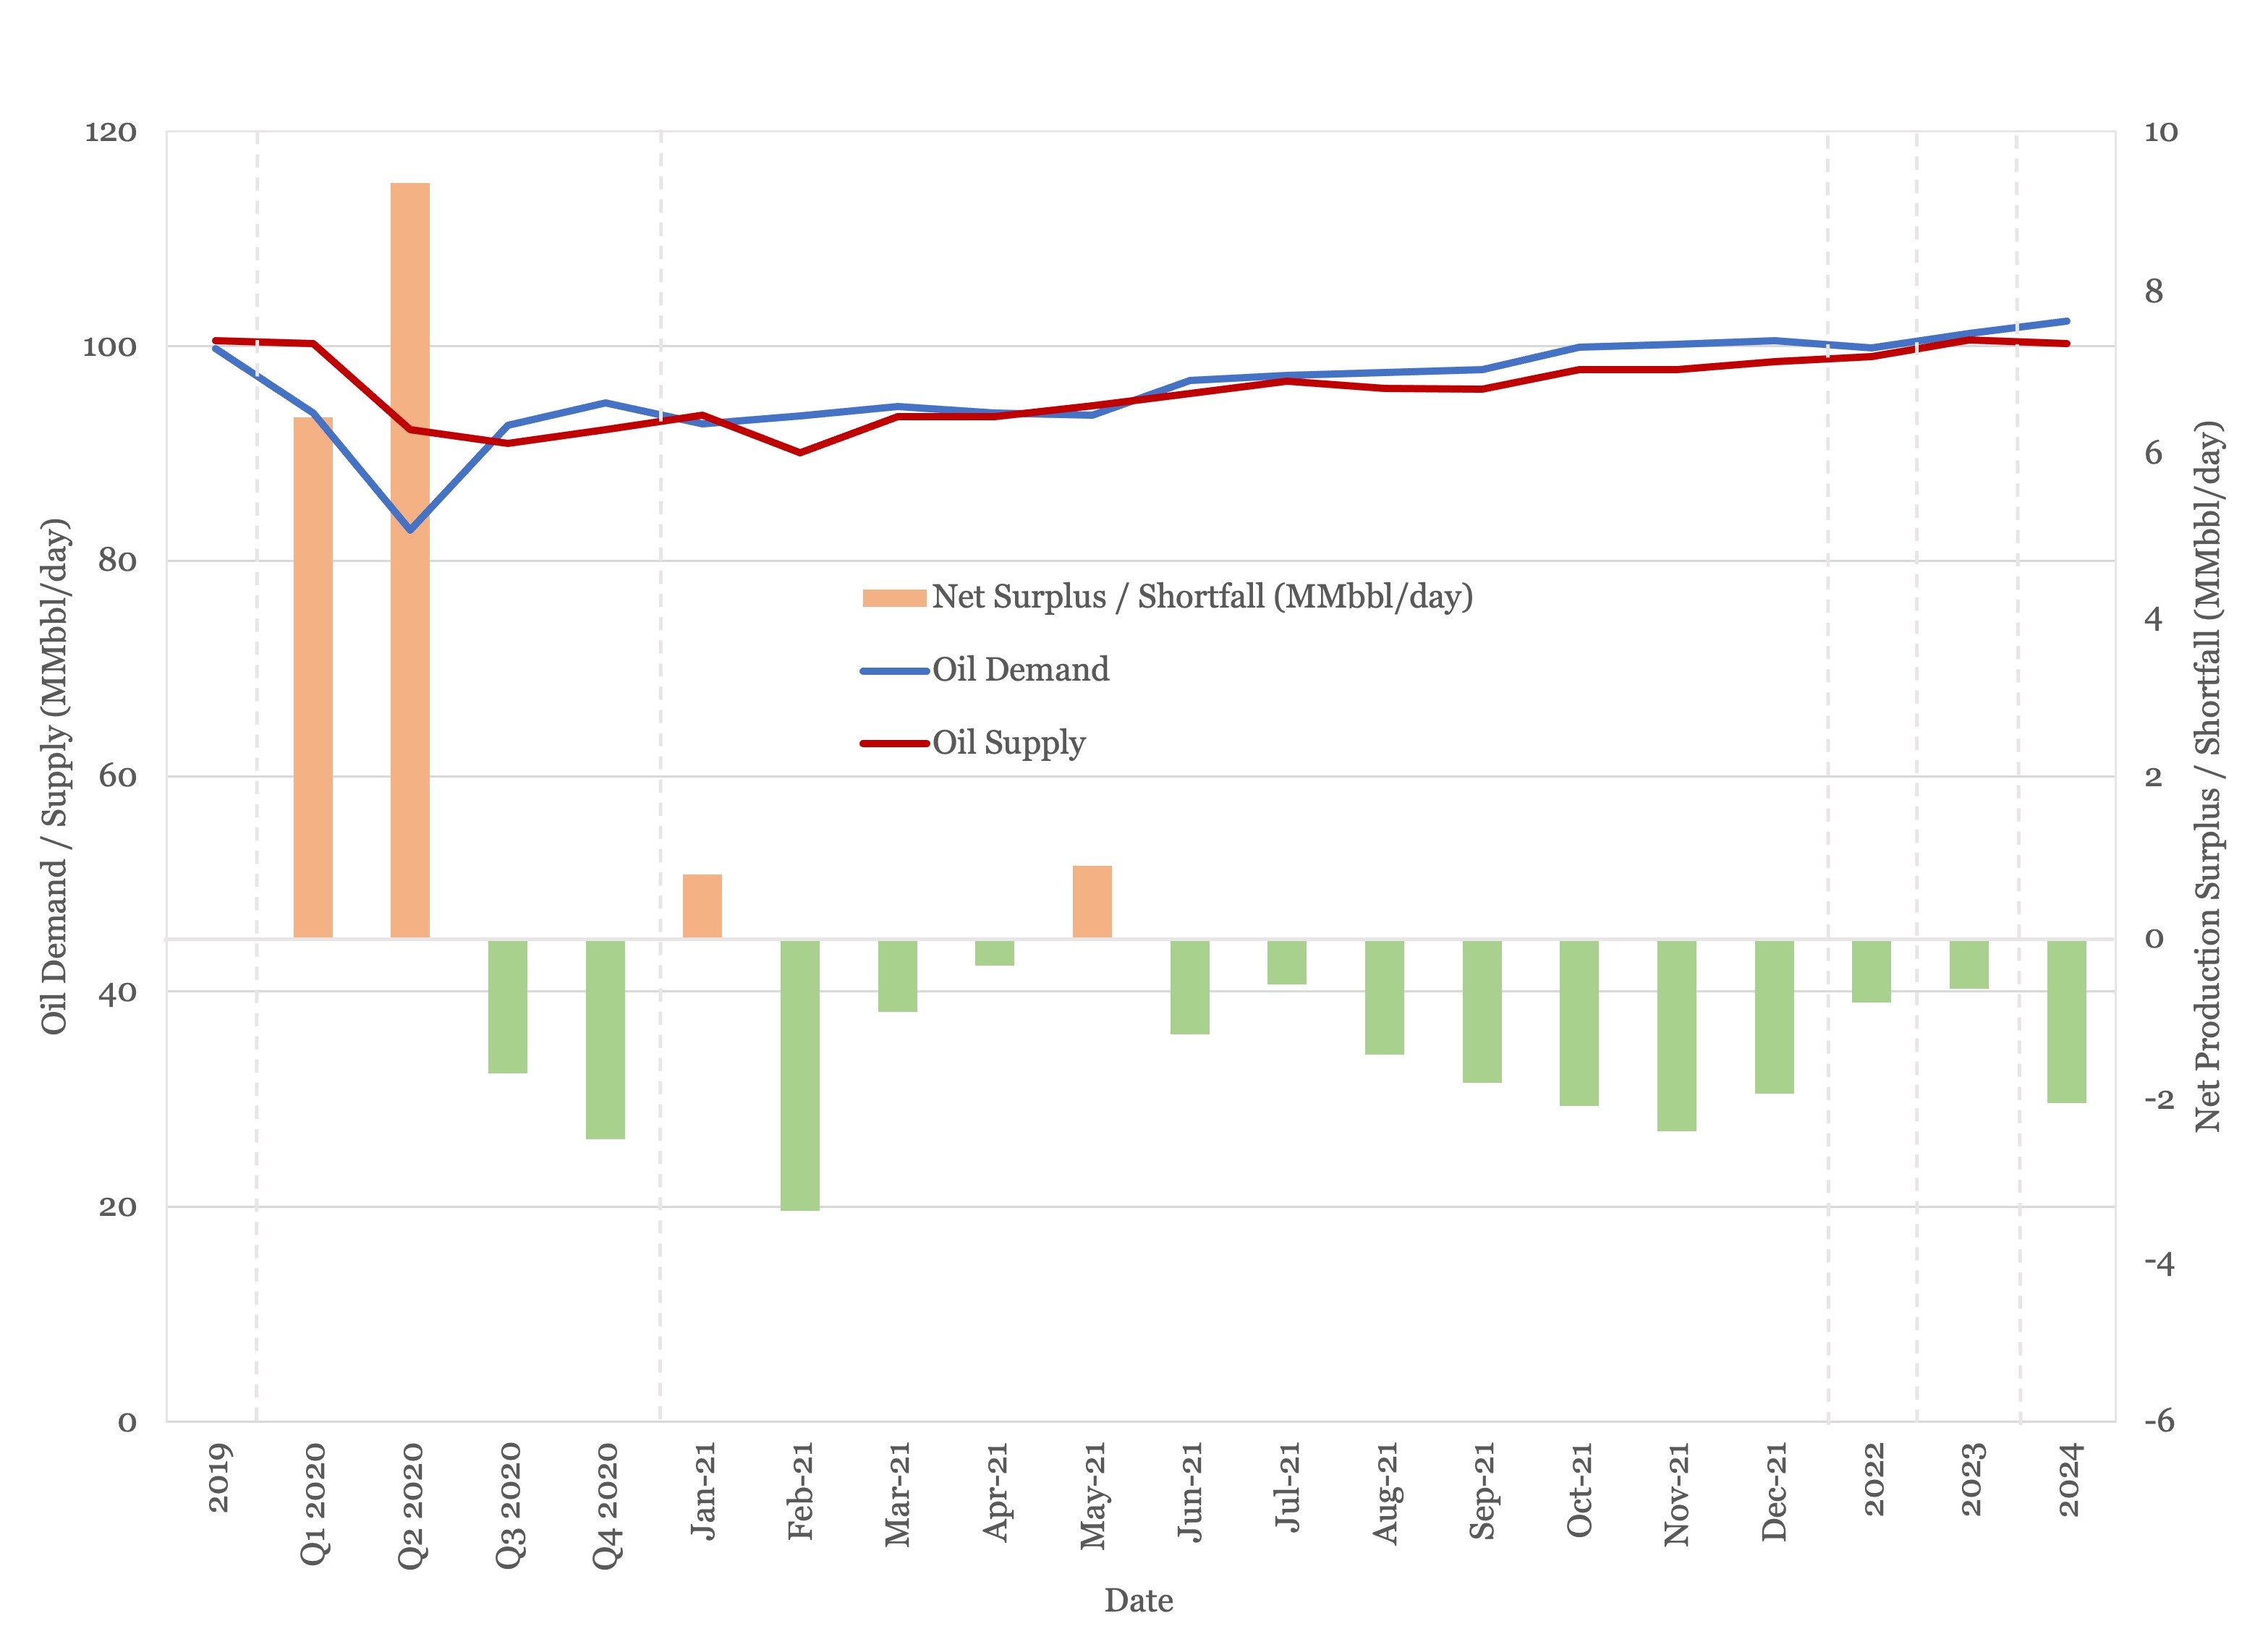
Figure 5 - Supply and Demand Surplus Forecast
Oil Storage
We estimate global oil inventory drawdowns of 119 MMbbl in the first half of 2021, rising to 318 MMbbl in the second half of the year as demand recovers. This represents a sharper drawdown than we anticipated last month.
Figure 6 shows global storage capacity and inventories. If supply and demand follow the current forecast, global inventories will still be slightly above the five year average by year end, falling below the five year average in 2022, with the deficit accelerating through 2023 and 2024.

Figure 6 - Global Storage Chart
Oil Prices
Both Brent and WTI spot prices rebounded strongly after last month’s decline, with Brent breaking through $85/bbl earlier this month and both Brent and WTI settling above $80/bbl at the time of writing. The EIA has raised their price estimate for Brent for the fourth quarter by $10/bbl to $81/bbl.
The same pattern has been reflected in the futures market, with both Brent and WTI futures showing their highest prices of the year through to 2025.

Figure 7 - Brent Crude Oil Futures
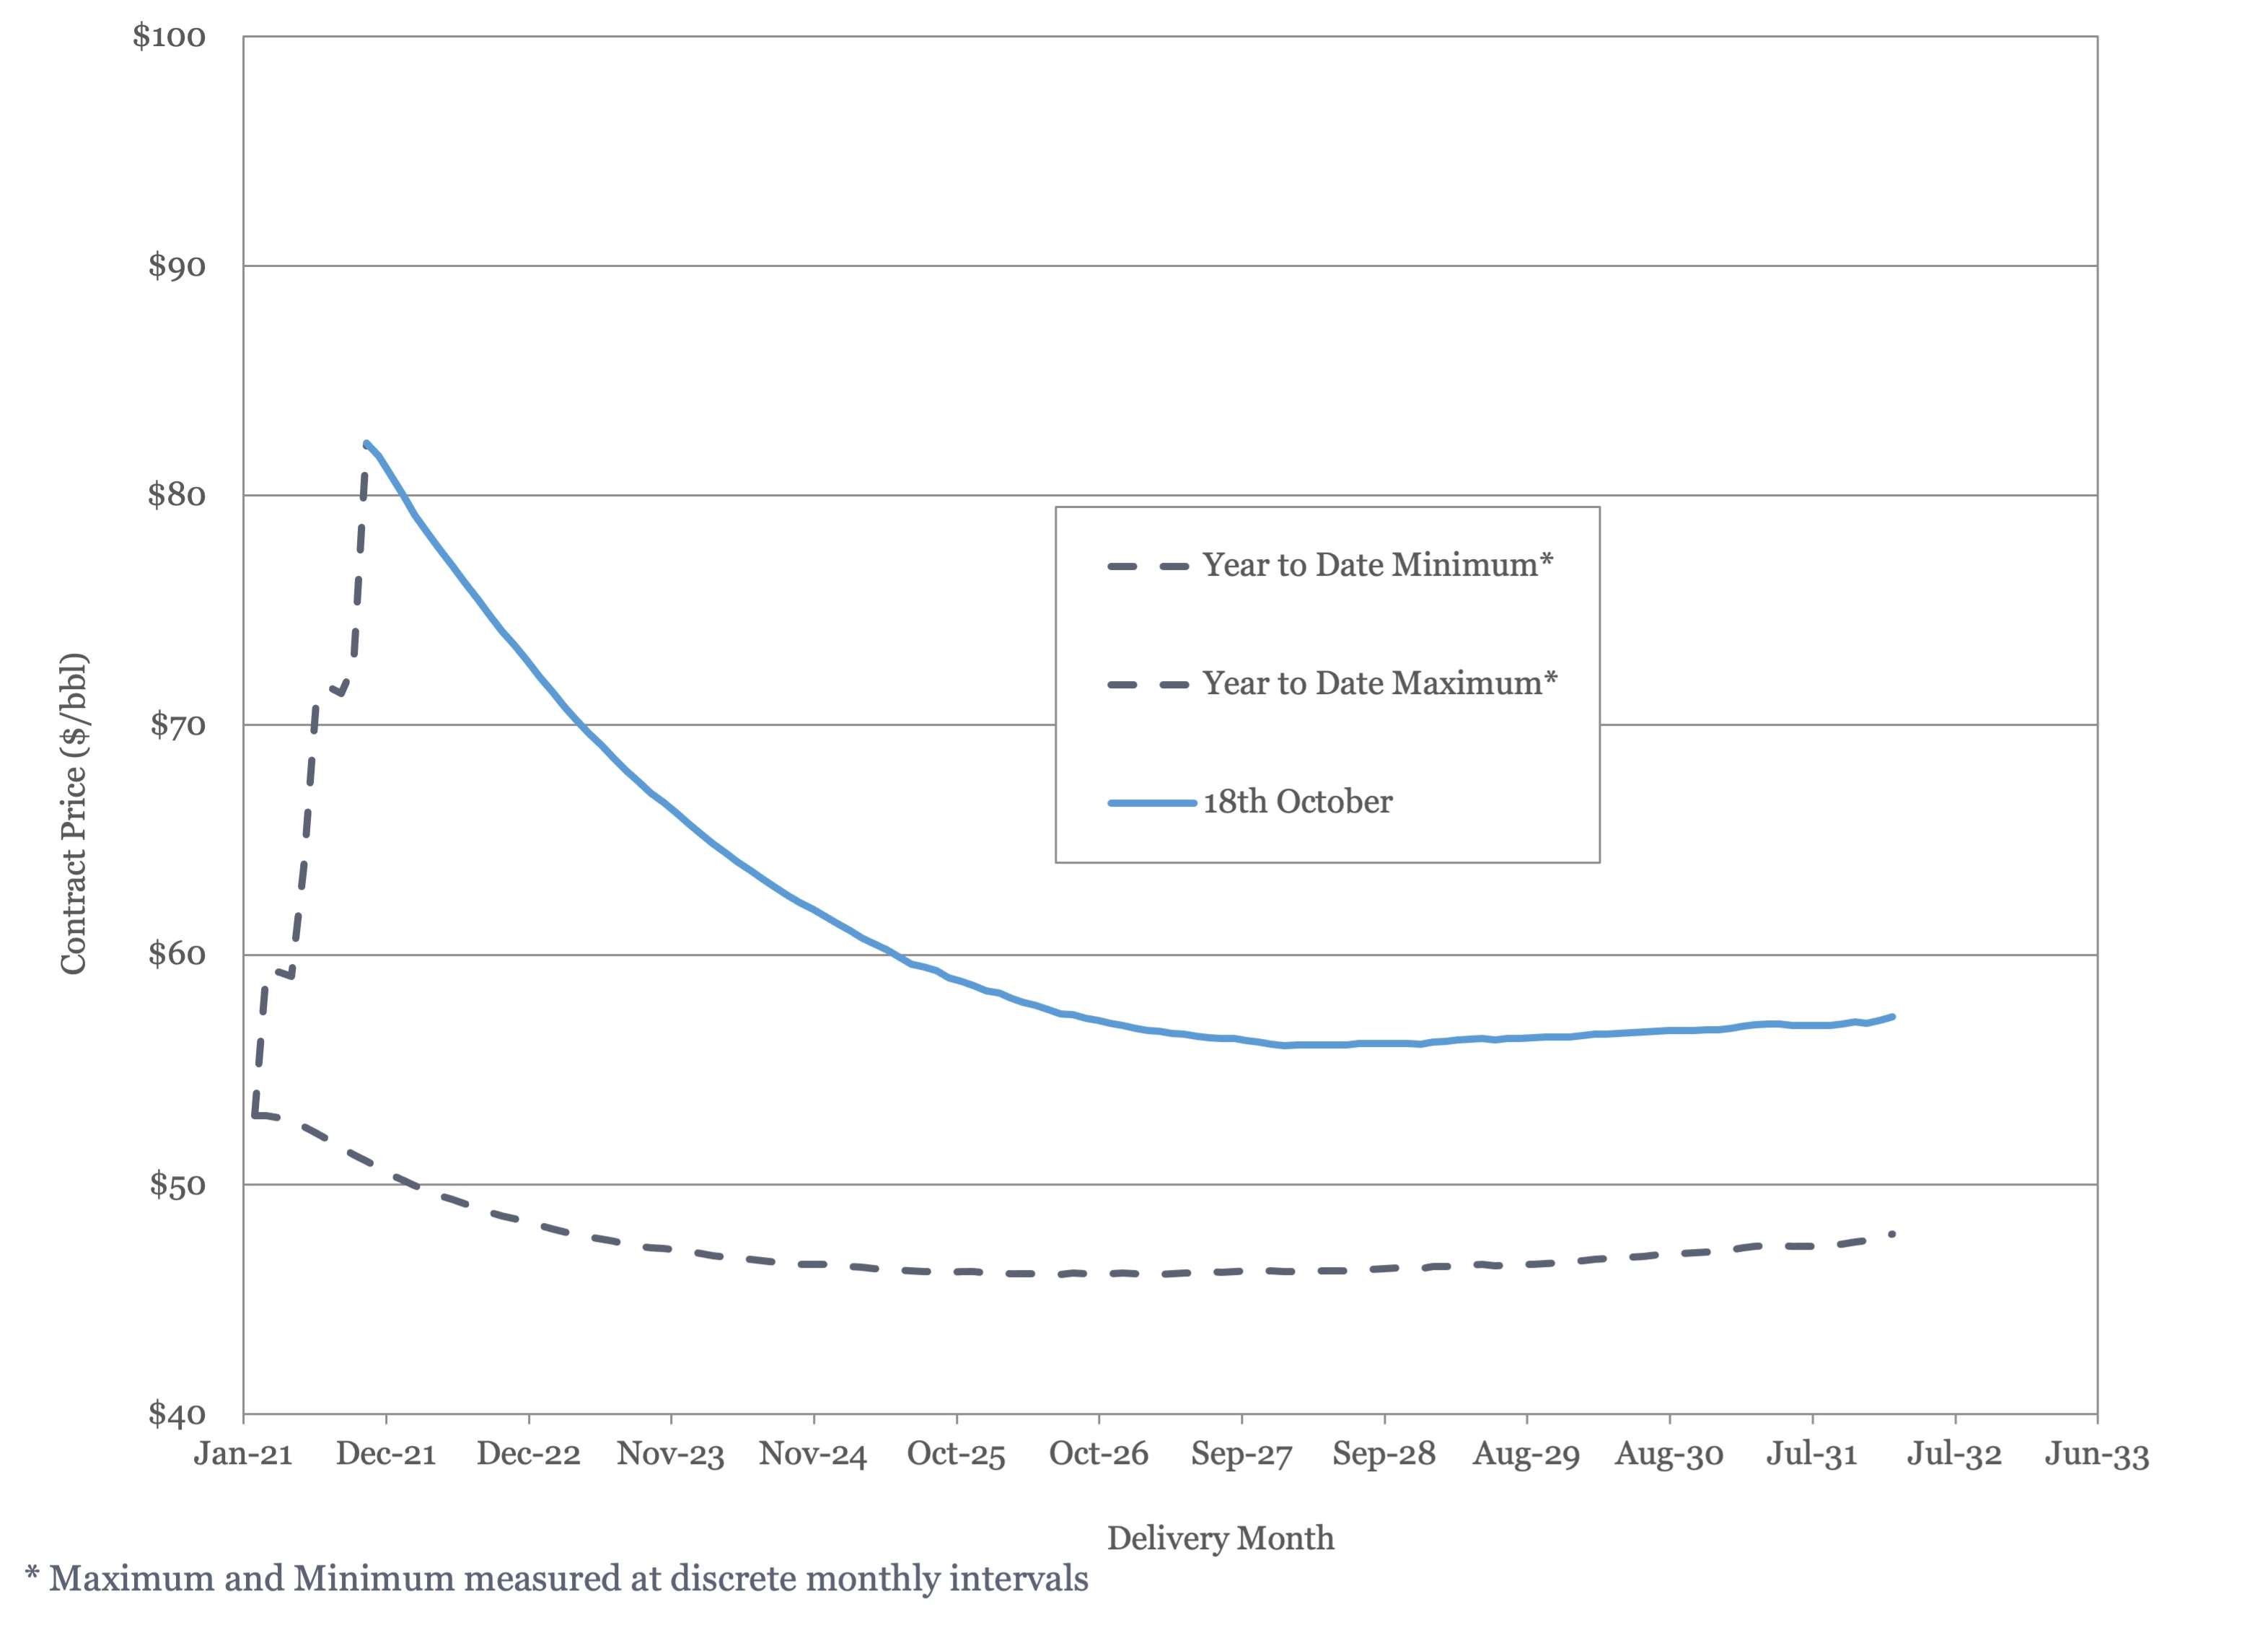
Figure 8 - WTI Crude Oil Futures
This sudden snapback suggests that last month’s concerns about the impact of the Delta variant, while resulting in small downgrades to this year’s demand estimates, may have been oversold.
US Activity
The US land oil rig count continued to climb this month rising from 406 on the 17th of September to 431 on the 18th of October. While we expect the rig count to continue to rise through this year and next, there is still no indication of an acceleration in activity.
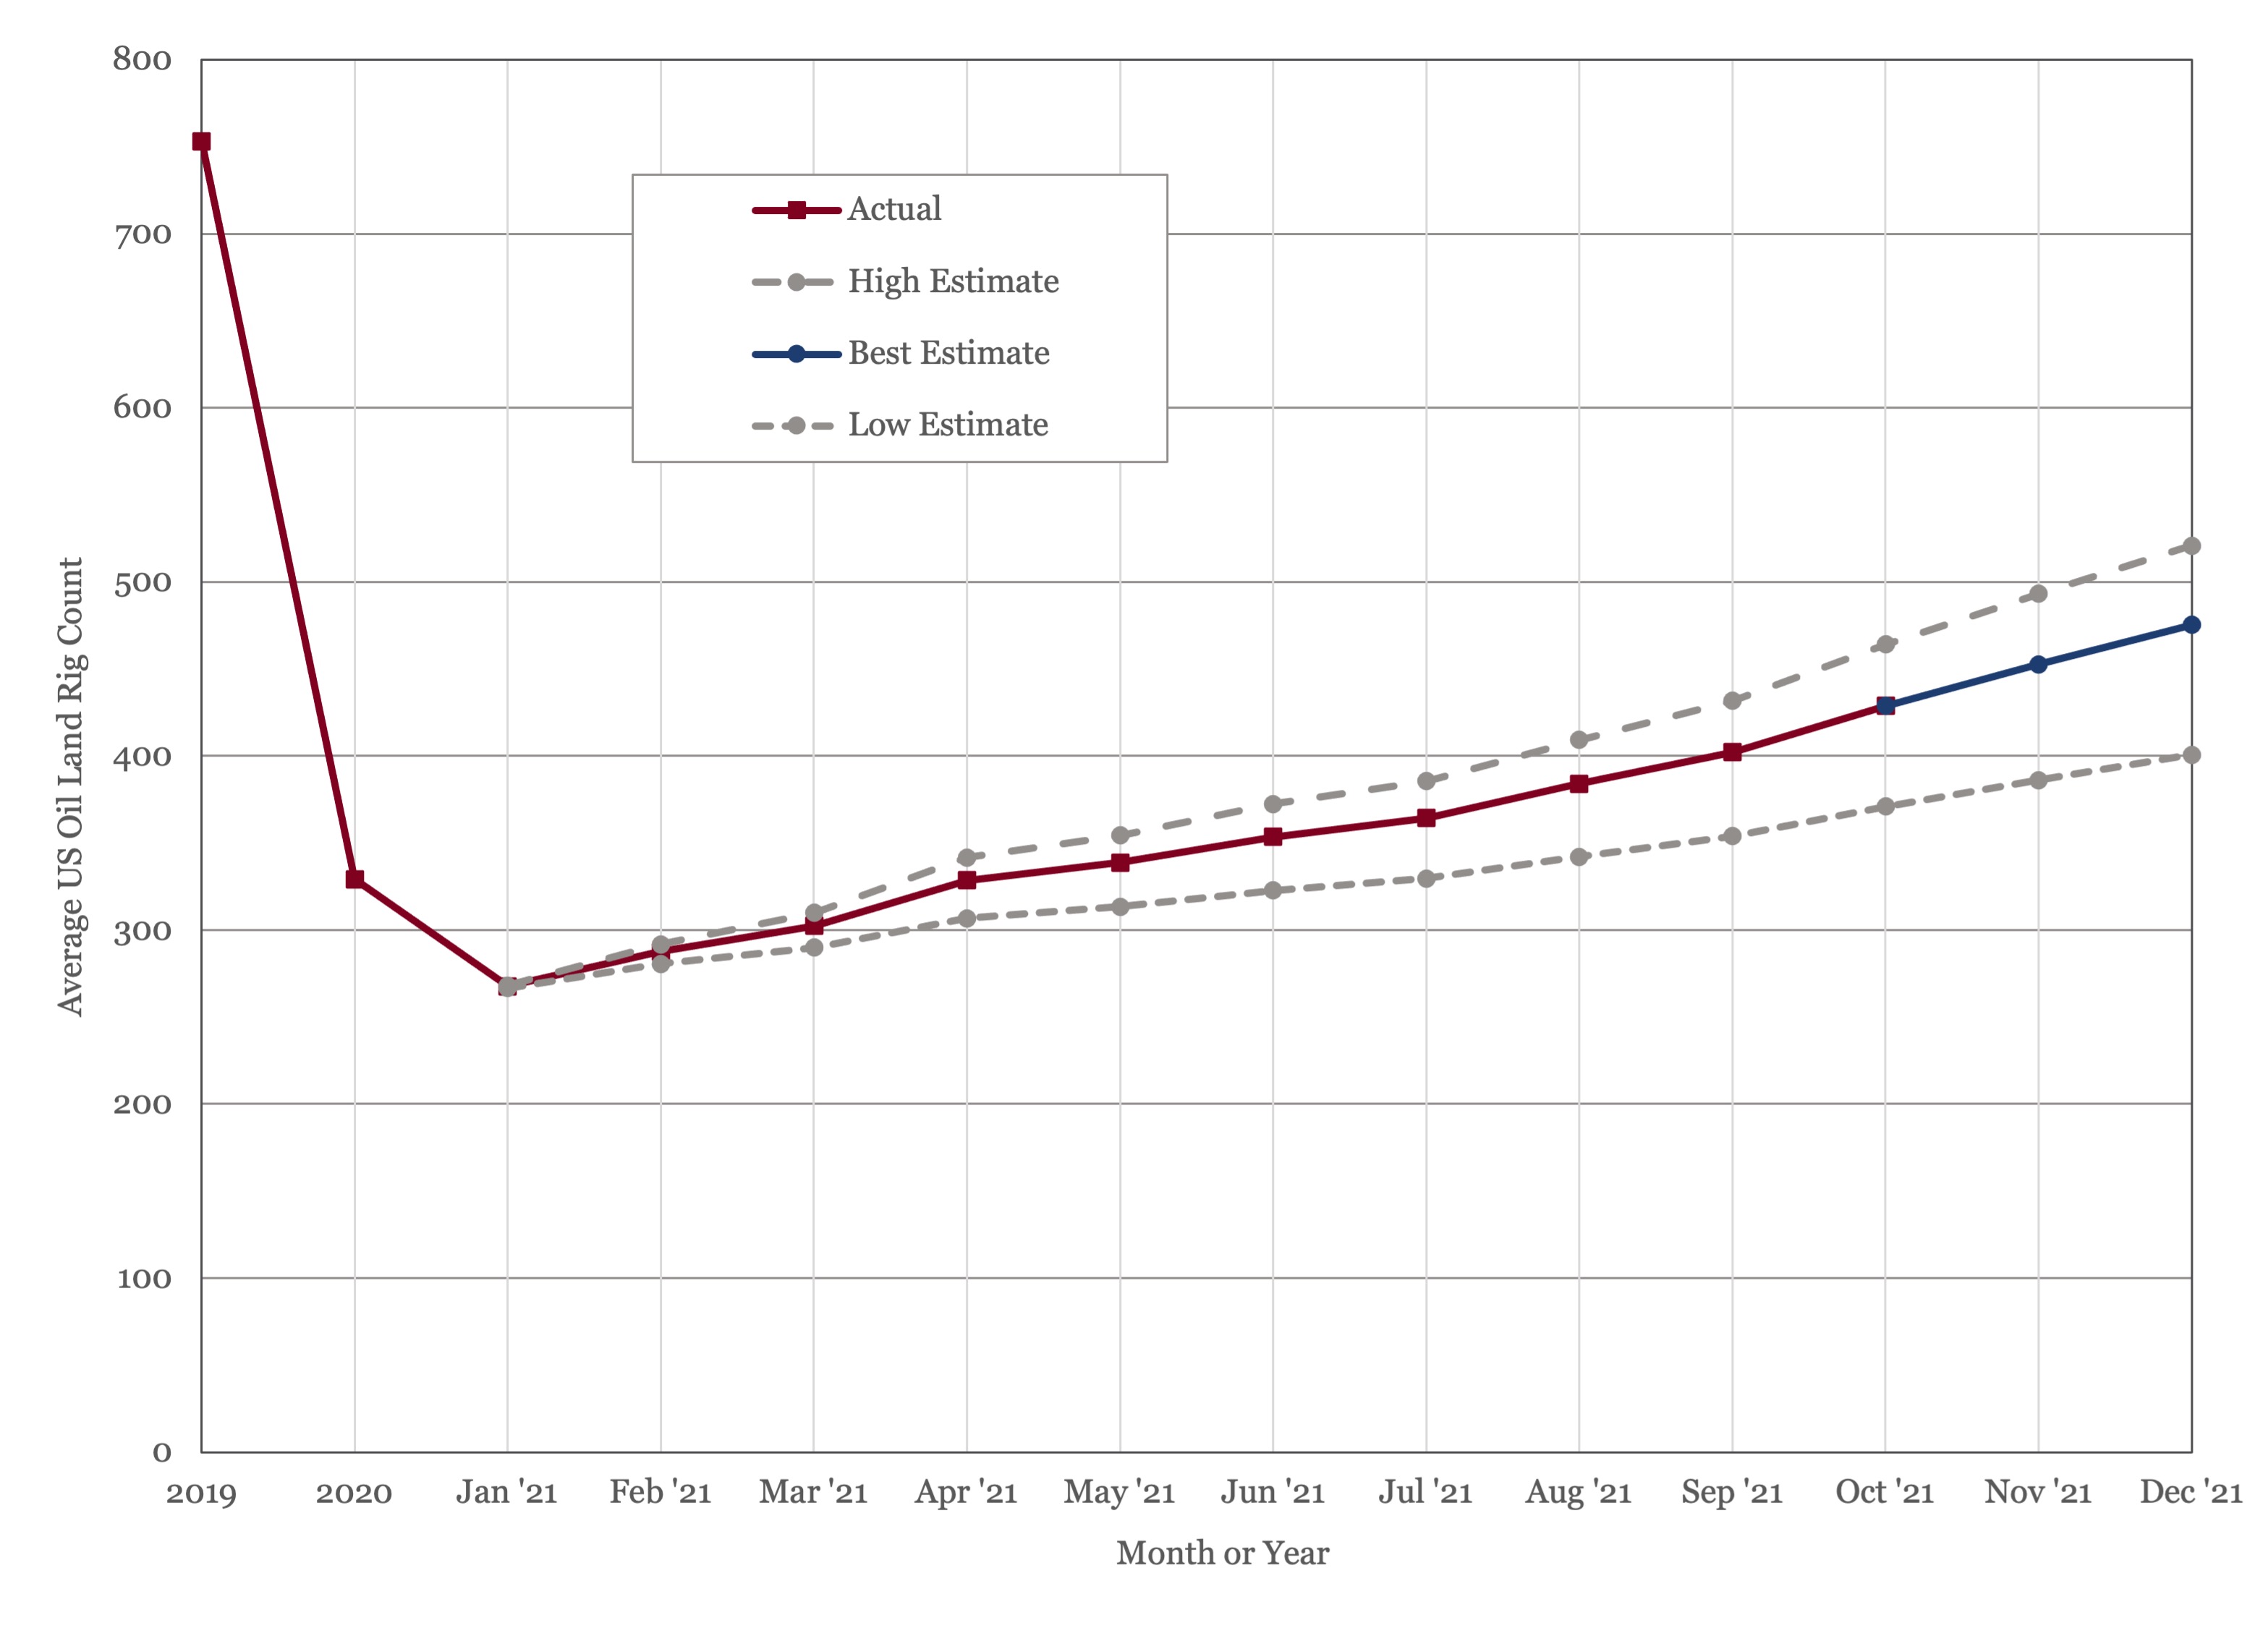
Figure 9 - US Land Oil Rig Count
Estimates of 2022 activity levels are starting to appear and US onshore drilling and completion activity could see a 20% rise in expenditure. However, this is unlikely to relate directly to a 20% rise in activity given inflation.
(1) “World Energy Outlook 2021”, International Energy Agency, October 2021
(2) “World Oil Outlook 2021”, Organisation of the Petroleum Exporting Countries, October 2021
(3) “Annual Energy Outlook 2021”, Energy Information Administration, October 2021
(4) Oil Market Report – September 2021, International Energy Agency
(5) “OPEC Monthly Oil Market Report”, Organization of the Petroleum Exporting Countries, October 13th, 2021.
(6) Short Term Energy Outlook (STEO), October 13th 2021, U.S. Energy Information Administration.
(7) “Biden renews OPEC outreach as oil prices climb 10% in September”, Julia Fanzeres, World Oil, September 30th, 2021.
(8) 21st OPEC and Non OPEC Ministerial Meeting, October 4th, 2021.
(9) “OPEC Boss Says World Can’t Afford to Underinvest in Oil”, Benoit Faucon and Summer Said, The Wall Street Journal, October 1st, 2021
(10) “The age of fossil-fuel abundance is dead”, The Economist, October 9th, 2021, edition.
(11) “Interior’s Haaland Hints at Limits on Fossil Fuel Extraction”, Jennifer A Dlouhy, Bloomberg Green, September 23rd, 2021.


Explore Our Services

Business Development
Oil & Gas an extractive industry, participants must continuously find and develop new oil & gas fields as existing fields decline, making business development a continuous process.

Strategy
We approach strategy through a scenario driven assessment of the client’s current portfolio, organizational competencies, and financial framework. The strategy defines portfolio actions and coveted asset attributes.
Origination
Deal origination consists of identifying coveted assets, assets with attributes consistent with the client’s strategy, and qualified buyers. We advocate a proactive approach to business development and will undertake outreach on our client’s behalf.

Transaction Support
Transaction support consists of in depth asset evaluation, negotiation of commercial agreements or preparation of license round submission and close out of conditions. We can also aid in joint venture set up and management and asset maturation as required.